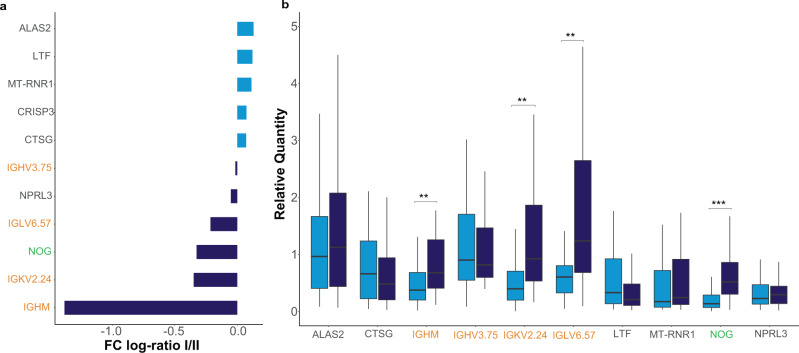
Fig. 6. Genes of interest with data based on our qPCR results of 91 patients (I = 53, II = 38) of the validation cohort.
a Mean expression fold change (log2 scaled) of the signature genes between validation subgroup I (immune inactive) and II (immune active). The fold ratio was generated based on negative delta Ct values (vs GAPDH). Genes over-expressed in subgroup I are denoted by light blue bars while genes primarily expressed in subgroup II are represented by dark blue bars. b The relative quantity (RQ) of each gene of interest relative to GAPDH using a two-sided t-test with medians and significant differences shown with pI-II (IGHM) = 8.256 × 10⁻³, pI-II (IGKV2.24) = 2.373 × 10⁻³, pI-II (IGLV6.57) = 5.908 × 10⁻³ and pI-II (NOG) = 1.233733 × 10⁻⁴. **p < 0.01, ***p < 0.001. Vertical centre line represents the median, top and bottom bounds of the box represent the first and third quartile, while the tips of the whiskers represent min and max values.

