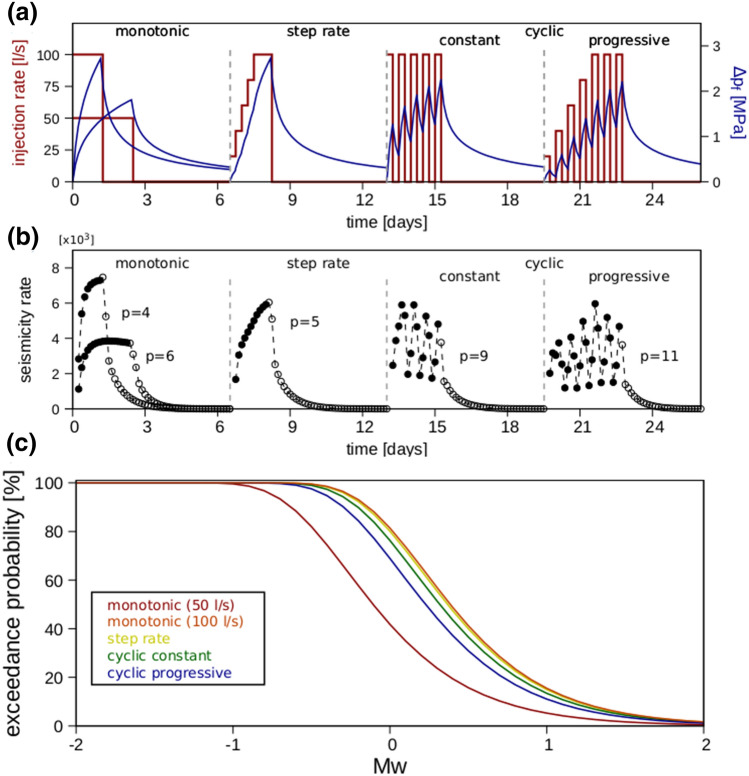
Figure 2.
Effects of injection protocols on induced seismicity rates and magnitudes. (a) Injection rates (red curves) and computed wellhead overpressure (blue curves) for the tested injection protocols. (b) Resulting seismicity rates and the power-law exponents (Eq. 8) that best fit the post-injection decay curves (empty circles). (c) Cumulative exceedance probability of a given magnitude Mw (Eq. 9). Each scenario lasted 6.5 days and used the same amount of net injected fluid volume (10,800 m3) and hydraulic energy (Figure S1). Different cases (upper and middle panels) have been shifted in time to ease visual comparison.

