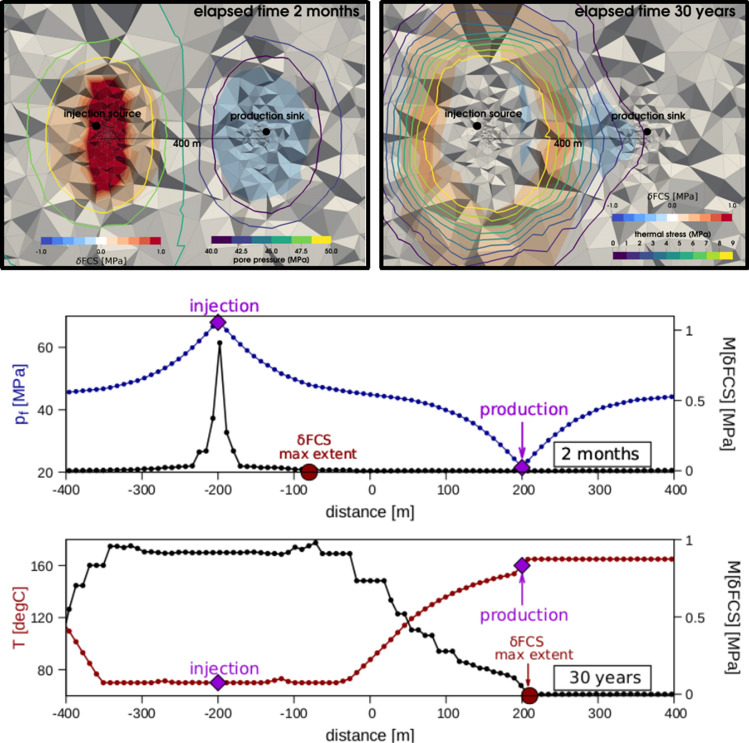
Figure 3.
Thermo-poroelastic stress transfer and induced variations in FCS during long-term geothermal operations. Upper panels: computed variations in FCS for a thermo-poroelastic simulation of a 30-year continuous injection and production. Left: model results at the time when pore pressure equilibrated in the system (maximum extent of the pore pressure front). Right: model results at the final stage of the operations. Background colours indicate computed values of , and isocountours of computed pore pressures (left panel) and thermal stresses (right panel). Lower panels: variations in computed extracted from the 3D model along a line passing through the injection-
source and production-sink. During the early stages of the system evolution, variations in FCS are bounded by the pore pressure front and show an abrupt decay away from the injection boreole that is driven by pore pressure diffusion only. Once pressure equilibrium is reached in the reservoir, variations in FCS are driven by changes in thermo-poroelastic stresses, thereby resulting in a larger seismic footprint and a more-gradual spatial decay away from the injection source.

