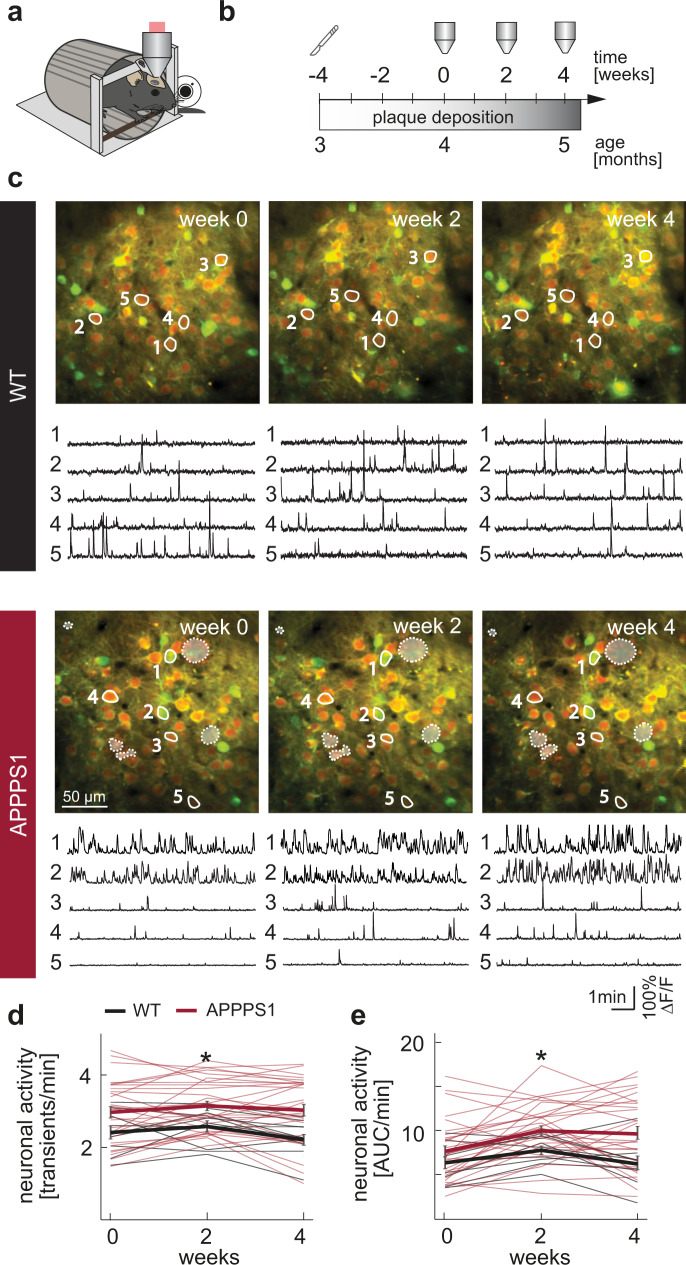
Fig. 1. Chronic in vivo imaging of individual neurons in awake mice.
a Schematic of the in vivo imaging setup. Mice were head-fixed, while neuronal activity was recorded through a cranial window. Whisking was recorded by a web camera. b Experimental timeline. Window implantation (scalpel icon) was conducted four weeks prior to the first imaging session. Imaging (objective icon) was performed at two-week intervals. Plaque deposition in the APPPS1 mouse line starts at ~8 weeks of age and plaque growth (gray gradient) takes place throughout the lifetime of these mice. c Representative projections of field of views (FOVs) in a WT and an APPPS1 mouse (red: mRuby2 expression, green: GCaMP6s, dashed lines indicate the location of amyloid plaques as assessed in larger overview stacks). Example calcium traces of neurons labelled within the projections are shown below. d Average neuronal activity of neurons in WT and APPPS1 mice, measured as transients per minute (effect of group: F1,72 = 6.07, p = 0.02; effect of time: F2,72 = 2.23, p = 0.12; group-by-time interaction effect: F2,72 = 0.91, p = 0.41, two way repeated measures ANOVA; thin lines: averages of individual FOVs (same set of neurons imaged over three consecutive time points); thick lines: mean ± SEM for each time point). e Neuronal activity assessed by quantification of the area under the curve (AUC) per minute across all time points (F1,72 = 4.58, p = 0.04; effect of time: F2,72 = 9.72, p = 0.0002; group-by-time interaction effect: F2,72 = 1.67, p = 0.2, two way repeated measures ANOVA; WT n = 9 (5 mice), APPPS1 n = 29 experiments (9 mice); thick lines: mean ± SEM) is increased in APPPS1 mice. *p < 0.05.

