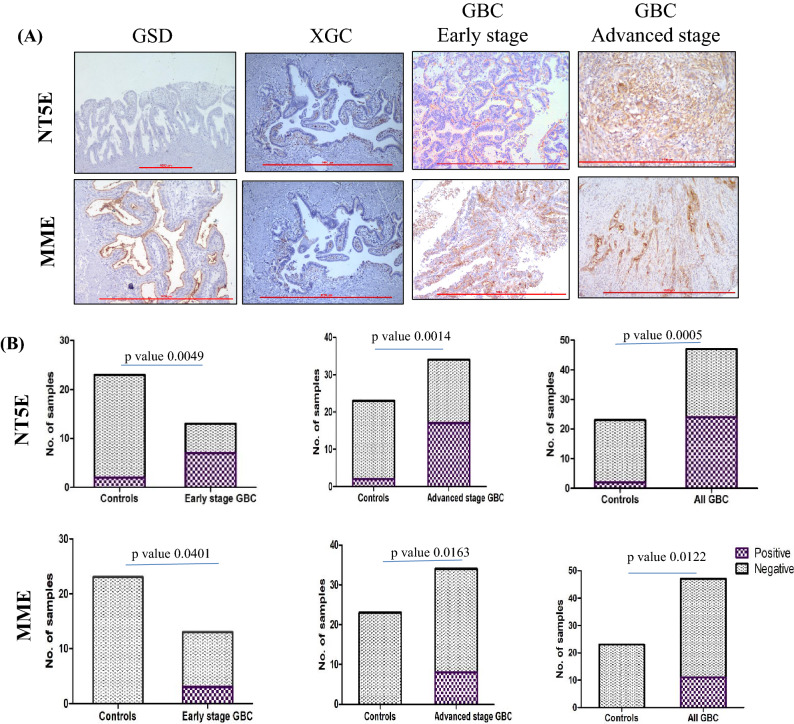
Figure 5.
IHC analysis to study the expression of NT5E and MME in controls and GBC cases. (A) Representative IHC images showing the expression of NT5E and MME in controls and GBC cases. IHC was performed on formalin-fixed paraffin-embedded (FFPE) tissue microarray (TMA) and individual tissue sections. An in-house TMA block was constructed using the FFPE blocks and included 6 controls (6 GSD cases) and 14 GBC cases (2 early stage and 12 advanced stage). Each TMA block consisted of tissue cores of 2 mm diameter and 4 µm sections were cut from the TMA block for carrying out IHC. Individual tissue sections (FFPE) of 33 GBC (11 early stage and 22 advanced stage) and 17 controls (10 GSD and 7 XGC cases) were also for IHC analysis. IHC results showed positive expression for NT5E in 53.84% of early and 50% of advanced stage GBC cases while MME showed positive expression in 23.07% of early and 23.52% of advanced stage GBC cases. (B) The statistical analysis showed a significant difference between cases and controls for NT5E and MME for both early stage and advanced stage GBC. The scale bar is shown as red line. IHC scoring is shown in “Methodology” section “Immunohistochemistry analysis”.

