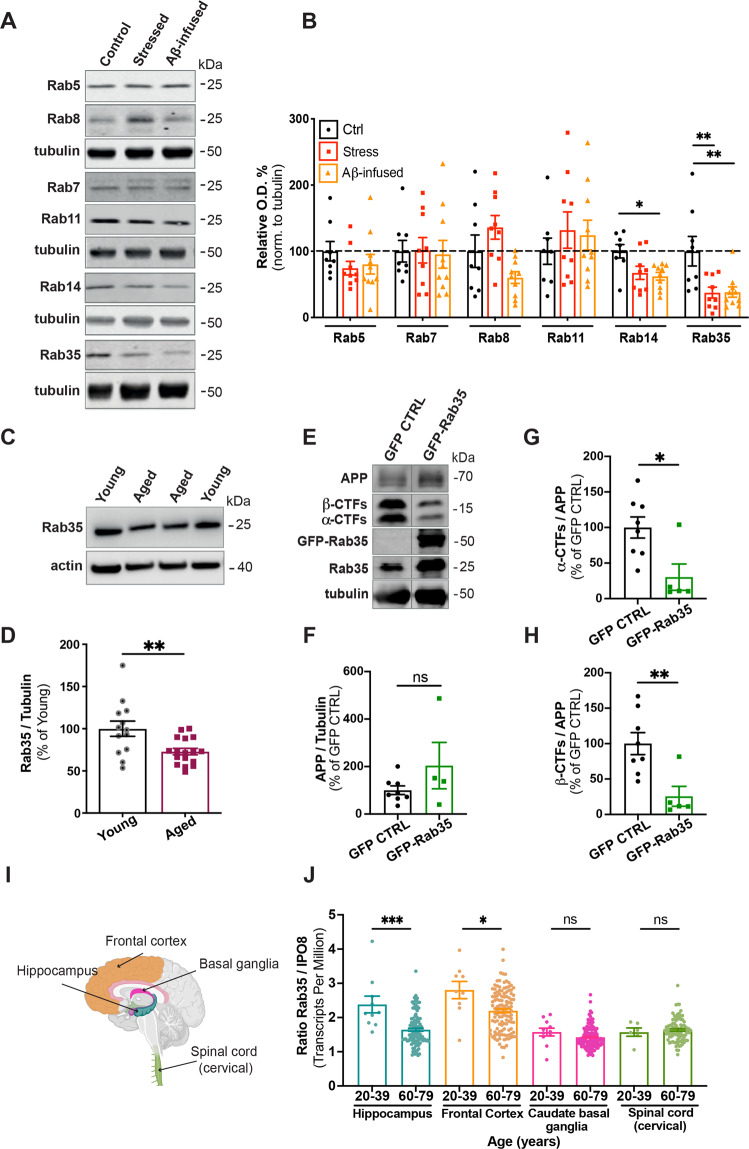
Fig. 1. Hippocampal Rab35 levels are decreased by chronic stress and aging.
A, B Representative immunoblots and quantification of Rab protein levels in the hippocampus of control (Ctrl), stressed, and Aβ-infused rats. Blots were probed for the noted Rabs and tubulin, with values normalized to tubulin and expressed as % of the control condition (dotted line)(**PRab35 CON vs. stressed = 0.0075, *PRab14 CON vs. Aβ-infused = 0.0228, **PRab35 CON vs. Aβ-infused = 0.0069; one-way ANOVA, Dunnet post hoc analysis, n = 8–10 animals/condition). C, D Representative immunoblots and quantification of Rab35 levels in the hippocampus of young (4 month old) and aged (22–24 month old) rats. Blots were probed for Rab35 and actin, with values normalized to actin and expressed as % of young animals (**P = 0.0056; unpaired t-test, n = 13–17/condition). E–H Representative immunoblots and quantification of full-length APP (F) and α-C-terminal and β-C-terminal fragments (CTFs) relative to full-length APP (G, H) in the dorsal hippocampus of rats bilaterally injected with AAV-GFP or AAV-GFP-Rab35. Blots were probed for APP, Rab35, and tubulin, with values normalized to tubulin and expressed as % of GFP control condition (*P = 0.017, **P = 0.0048; Welch’s unpaired two-tailed t-test, n = 4–8 animals/condition). I Schematic diagram of human brain areas used for the analysis of transcriptome data from the Genotype-Tissue Expression (GTEx) project, created with BioRender. J Quantification of Rab35 mRNA transcripts from individuals ages 20–39 years and 60–79 years, normalized to IPO8 (*P = 0.0155, **P = 0.0003; Mann–Whitney test, n = 6–135 samples/condition). All numeric data represent mean ± SEM.

