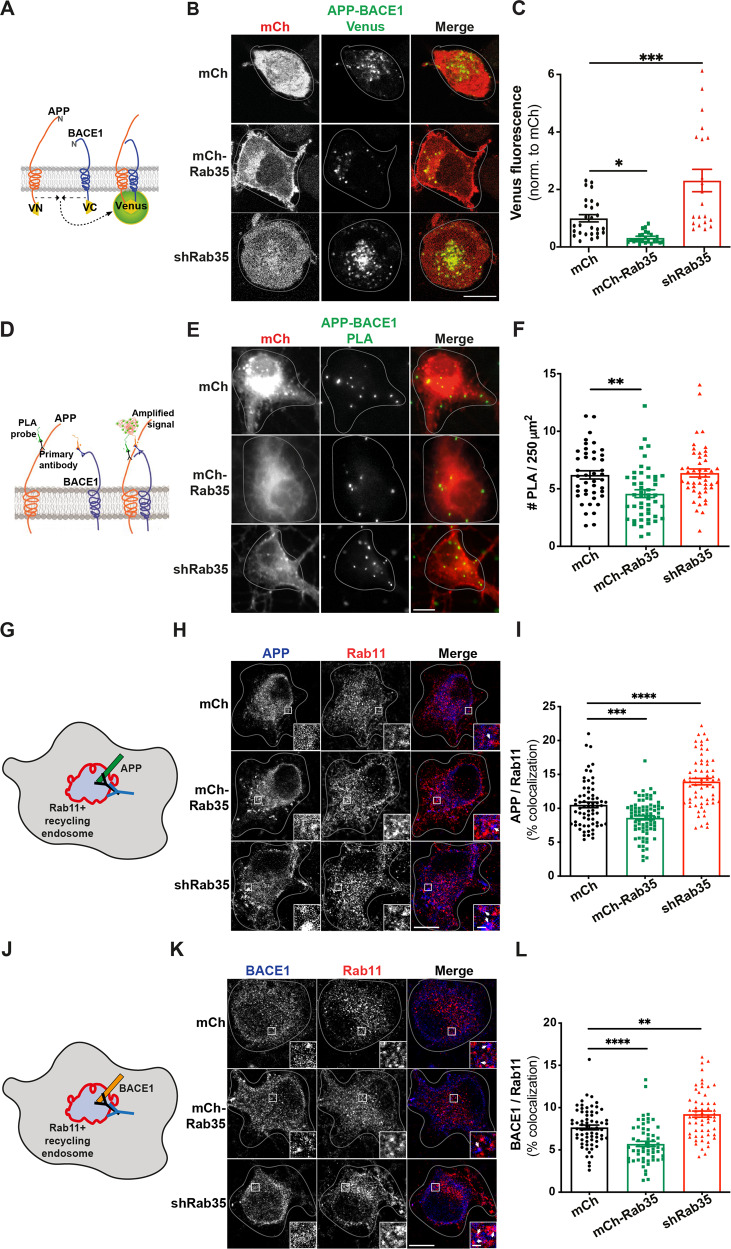
Fig. 3. Rab35 negatively regulates APP-BACE1 interaction and endosomal localization in hippocampal neurons.
A Schematic diagram of bimolecular fluorescence complementation assay, in which APP and BACE1 are tagged with complementary fragments of Venus fluorescent protein (VN and VC, respectively). Reconstitution of Venus fluorescence occurs upon interaction of APP and BACE1. B, C Representative images and quantification of Venus fluorescence in N2a cells expressing APP:VN, BACE:VC, and either mCh, mCh-Rab35, or shRab35 (*P = 0.042, ***P = 0.0001; one-way ANOVA, Dunnet post-hoc analysis, n = 21–27 cells/condition, two experiments). D Schematic diagram of proximity ligation assay (PLA), in which APP and BACE1 are labeled with primary antibodies, which are then recognized by anti-mouse and anti-rabbit PLA probes conjugated to oligonucleotides. When the probes are in close proximity, the oligos become ligated and can be amplified to produce a fluorescent signal marking protein–protein interaction. E, F Images and quantification for PLA, showing endogenous APP-BACE1 interaction in hippocampal neurons expressing mCh, mCh-Rab35, or shRab35 (**P = 0.001; unpaired student’s t-test, n = 43–44 cells/condition, two independent cultures). G Schematic diagram depicting immunostaining of APP (blue) and Rab11 recycling endosomes (red). H, I Representative images and quantification of APP colocalization with Rab11 (white arrowheads in insets) in hippocampal neurons expressing mCh, mCh-Rab35, or shRab35 (***P = 0.001, ****P < 0.0001; one-way ANOVA, Dunnet post-hoc analysis, n = 62–78 cells/condition, three independent cultures). J Schematic diagram depicting immunostaining of BACE1 (blue) and Rab11-positive recycling endosomes (red). K, L Representative images and quantification of BACE1 colocalization with Rab11 (white arrowheads in insets) in hippocampal neurons expressing mCh, mCh-Rab35, or shRab35 (**P = 0.001, ****P < 0.0001; one-way ANOVA, Dunnett’s post-hoc analysis, n = 58–66 cells/condition, three independent cultures). Scale bars: 10 µm; 1 µm for zoomed insets. All numeric data represent mean ± SEM.

