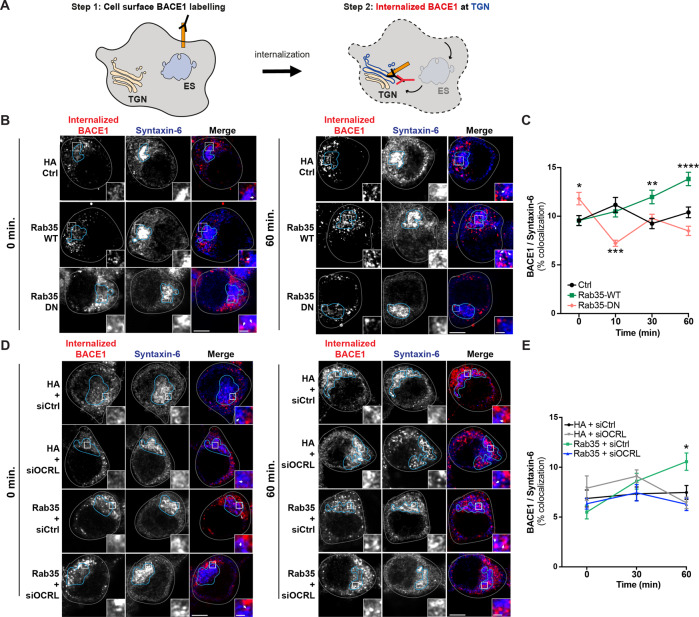
Fig. 4. Rab35 stimulates retrograde trafficking of BACE1 via OCRL.
A Schematic representation of BACE1 internalization assay, in which cell-surface BACE1 was labeled with FLAG antibody, cells were incubated for 0, 10, 30, or 60 min to allow for BACE1 internalization, and finally, cells were immunostained with syntaxin-6 antibodies to label the TGN. B, C Representative high-resolution images (Zeiss Airyscan) and quantification of BACE1 internalization in N2a cells expressing FLAG-BACE1 and either HA Control, HA-Rab35 wild-type (WT), or HA-Rab35 dominant-negative (DN). Internalized BACE1 (red) and syntaxin-6 (blue) are shown at 0 and 60 min time points post-labeling, with cells outlined in gray, the TGN outlined in blue, and white arrowheads pointing to areas of colocalization in insets (*PDN-0 min = 0.0392, **PDN-10 min = 0.0011, **PWT-30 min = 0.0025, ****PWT-60 min < 0.0001; 2-way ANOVA and Sidak post hoc analysis, n = 45–155 cells per condition/timepoint, 2–5 experiments. Time × Rab35 interaction F6,1253 = 8.002, P < 0.0001, overall Rab35 effect F2,1253 = 10.43, P < 0.0001). D, E Representative high-resolution images (Zeiss Airyscan) and quantification of BACE1 internalization in N2a cells expressing FLAG-BACE1 and HA or HA-Rab35 together with control siRNA (siCtrl) or siRNA to knockdown OCRL (siOCRL). Internalized BACE1 (red) and syntaxin-6 (blue) are shown at 0 and 60 min time points post-labeling (*PHA+siCtrl vs. Rab35+siCtrl = 0.0151, 2-way ANOVA and Tukey’s multiple comparisons test, n = 50–61 cells per condition/time point, two experiments. Time × Condition interaction F6,635 = 3.861, P = 0.009). Scale bars: 5 µm; 1 μm for zoomed insets. All numeric data represent mean ± SEM.

