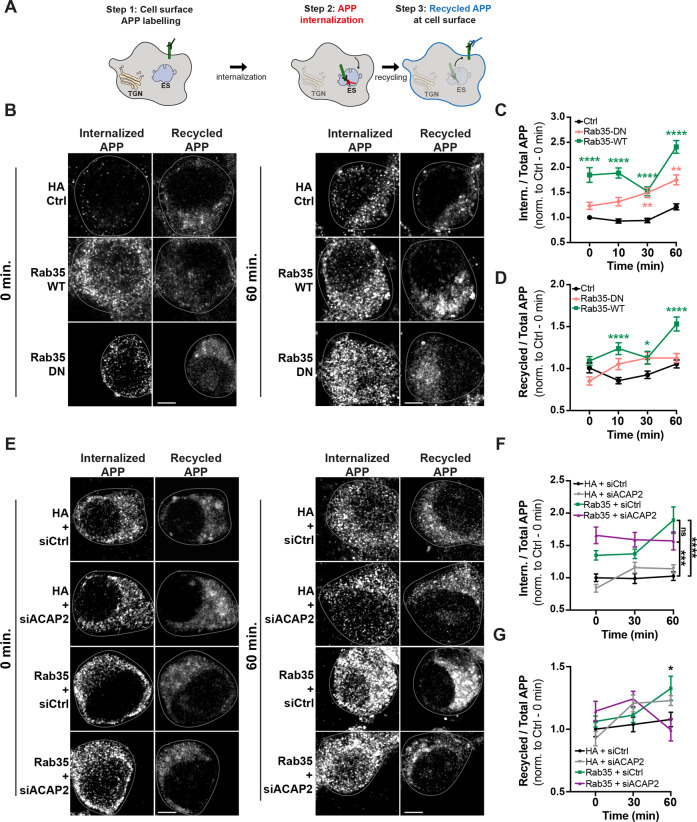
Fig. 5. Rab35 stimulates APP recycling to the plasma membrane via ACAP2.
A Schematic representation of the APP recycling assay, in which APP internalization and recycling were assessed by labeling cell-surface APP with 22C11 antibody followed by cell incubation for 0, 10, 30, or 60 min, and fixation and immunostaining with secondary antibodies to detect recycled or internalized APP. B–D Representative images and quantification of APP internalization and recycling in N2a cells expressing APP-GFP and either HA control, HA-Rab35 WT, or HA-Rab35 DN. Internalized and recycled APP are shown at 0 and 60 min time points post-labeling, with cells outlined in gray (*PWT-30 min = 0.0299, **PDN-30 min = 0.0027, **PDN-60 min = 0.0017, ****P < 0.0001, 2-way ANOVA and Sidak post-hoc analysis, n = 53–269 cells per condition/timepoint, 2–5 experiments. For APP internalization: Time × Rab35 interaction F6,1897 = 3.002, P = 0.0064, overall Rab35 effect F2,1897 = 118.9. For APP recycling: Time × Rab35 interaction F6,1897 = 3.443, P = 0.0022, overall Rab35 effect F2,1897 = 26.03). E–G Representative images and quantification of APP internalization and recycling in N2a cells expressing APP-GFP and either HA or HA-Rab35, together with control siRNA (siCtrl) or siRNA to knockdown ACAP2 (siACAP2). Internalized and recycled APP are shown at 0 and 60 min time points post-labeling (for F ***PHA+siCtrl vs. Rab35+siACAP2 = 0.0003, ****PHA+siCtrl vs. Rab35+siCtrl < 0.0001, 2-way ANOVA and Tukey’s multiple comparisons test, n = 20–48 cells per condition/timepoint, three experiments. Time × Rab35 interaction F4,310 = 2.843, P = 0.0244, overall Rab35/ACAP2 effect F2,310 = 39.12, P < 0.0001. G *PHA+siCtrl vs. Rab35+siCtrl = 0.0457, PHA+siCtrl vs. Rab35+siACAP2 = 0.66, two-way ANOVA with Tukey’s multiple comparisons test, n = 20–48 cells per condition/timepoint, three experiments. Time × Condition interaction F4,310 = 2.877, P = 0.023, overall Condition effect F2,310 = 3.279, P = 0.039). Scale bars: 5 µm. All numeric data represent mean ± SEM.

