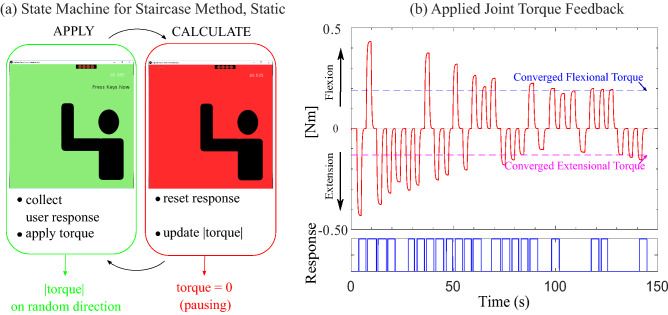
Figure 5.
(a) Schematic diagram of state machine for static condition, and (b) example of a static JND test result. The programmed state machine (a) switches state between APPLY (applying torque) to CALCULATE (pausing torque). The APPLY state determines the direction of the torque randomly. The applied torque is graphed in the top panel of (b). Flexional torque is shown on the positive y-axis, and extensional torque is plotted on the negative y-axis. The CALCULATE state updates the magnitude of the torque based on the user’s response. The user responses versus time are shown in the bottom panel of (b), where a high value represents “perceived,” and a low value represents “not perceived.” A series of “perceived” responses leads to a decreasing input magnitude while the consecutive “not perceived” answers lead to the torque increasing. This continues for a specified number of transition points. Both directional torques converge to final values that are illustrated in the top panel of (b) as a blue dashed line for flexion and a magenta dashed line for extension.

