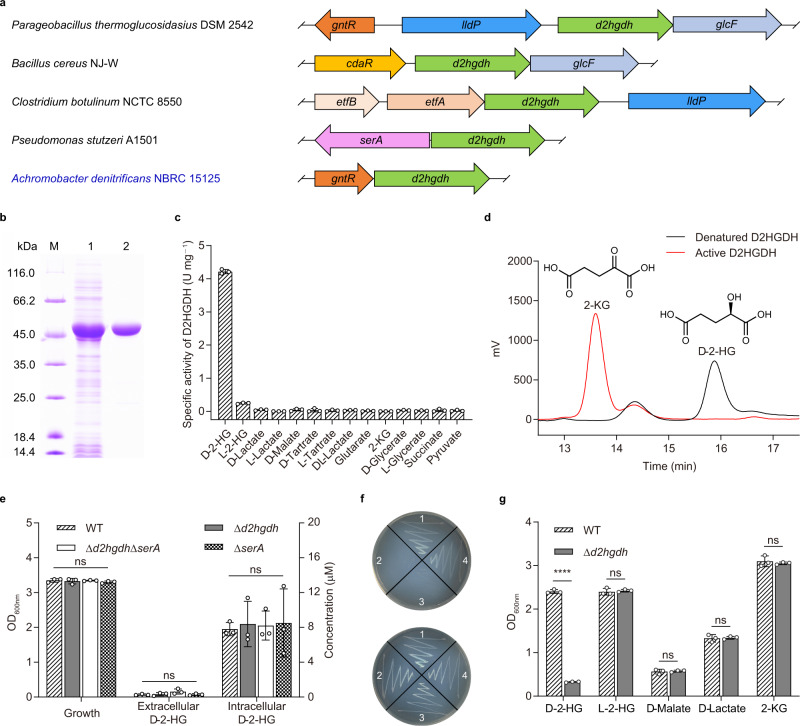
Fig. 1. D2HGDH contributes to d-2-HG catabolism in A. denitrificans NBRC 15125.
a Schematic representation of genome context analysis of d2hgdh in different species. Orthologs are shown in the same color. Arrows indicate the direction of gene translation. The corresponding proteins encoded by the indicated genes are d-2-HG dehydrogenase (d2hgdh), GntR family regulator protein (gntR), lactate permease (lldP), glycolate oxidase iron-sulfur subunit (glcF), carbohydrate diacid regulator (cdaR), electron transfer flavoprotein alpha/beta-subunit (etfA/B), and 3-phosphoglycerate dehydrogenase (serA). b SDS-PAGE analysis of purified D2HGDH in A. denitrificans NBRC 15125. Lane M, molecular weight markers; lane 1, crude extract of E. coli BL21(DE3) harboring pETDuet-d2hgdh; lane 2, purified D2HGDH using a HisTrap column. c Substrate specificity of D2HGDH in A. denitrificans NBRC 15125. Data shown are mean ± standard deviations (s.d.) (n = 3 independent experiments). d HPLC analysis of the product of D2HGDH-catalyzed d-2-HG dehydrogenation. The reaction mixtures containing d-2-HG (1 mM), 3-(4,5-dimethylthiazol-2-yl)-2,5-diphenyltetrazolium bromide (MTT, 5 mM), and active or denatured D2HGDH (1 mg mL−1) in 50 mM Tris-HCl (pH 7.4) were incubated at 37 °C for 30 min. Black line, the reaction with denatured D2HGDH; red line, the reaction with active D2HGDH. e Growth, extracellular, and intracellular d-2-HG concentrations of A. denitrificans NBRC 15125 and its derivatives cultured in LB medium at mid-log stage. Data shown are mean ± s.d. (n = 3 independent experiments). f Growth of A. denitrificans NBRC 15125 and its derivatives on solid minimal medium containing 5 g L−1 d-2-HG (top) or 2-KG (bottom) as the sole carbon source after 36 h. 1. A. denitrificans NBRC 15125; 2. A. denitrificans NBRC 15125 (Δd2hgdh); 3. A. denitrificans NBRC 15125 (Δd2hgdhΔserA); 4. A. denitrificans NBRC 15125 (ΔserA). g Growth of A. denitrificans NBRC 15125 and A. denitrificans NBRC 15125 (Δd2hgdh) in minimal medium containing different carbon sources after 24 h. Data shown are mean ± s.d. (n = 3 independent experiments). The significance was analyzed by a two-tailed, unpaired t-test. ****P < 0.0001; ns, no significant difference (P ≥ 0.05). Exact P values are reported in the Source Data file. Source data are provided as a Source Data file.

