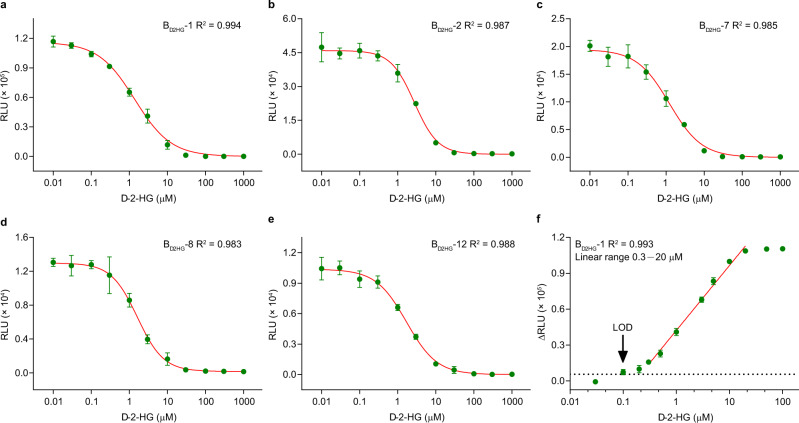
Fig. 4. Optimization of the d-2-HG biosensor (Bd2HG).
a–e Responses of the optimized biosensors to different concentrations of d-2-HG. a Dose-response curve of Bd2HG-1; b dose-response curve of Bd2HG-2; c dose-response curve of Bd2HG-7; d dose-response curve of Bd2HG-8; e dose-response curve of Bd2HG-12. f The linear detection range of Bd2HG-1. Black dotted line is a reference line where the reduced luminescence signal (∆RLU) is three times of the background signal. The concentrations of DhdR and Bio-dhdO mutants in a–f were 0.3 and 1 nM, respectively. Data shown are mean ± s.d. (n = 3 independent experiments). Source data are provided as a Source Data file.

