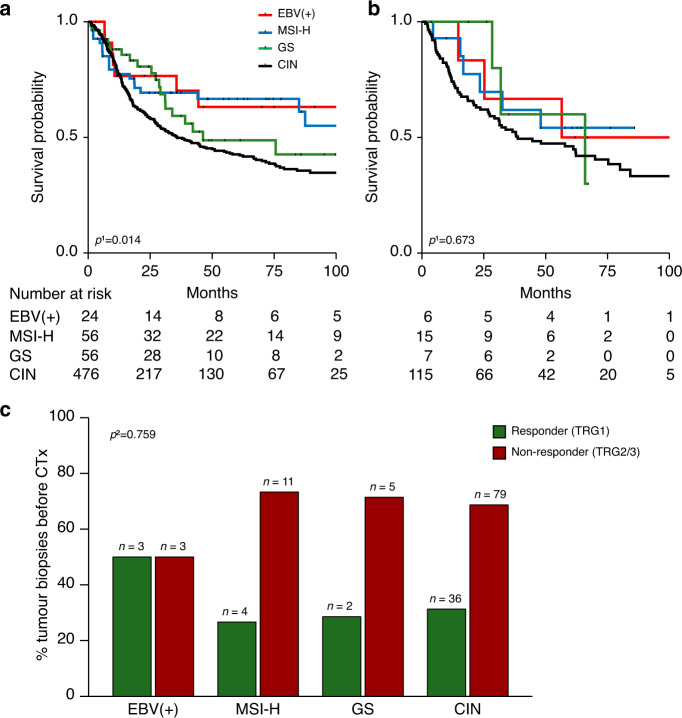
Fig. 2. Molecular classification according to TCGA and association with patients’ survival and response to neoadjuvant CTx.
Patients’ survival is discriminated by the four molecular TCGA subgroups and Kaplan–Meier curves are shown for patients with resected tumours with or without CTx (a) and for patients with tumour biopsies before CTx (b). The response to neoadjuvant CTx (c) is shown for patients with tumour biopsies before CTx in relation to the respective molecular subgroups. MSI-H high microsatellite instability, GS genomic stable, CIN chromosomal instability, TRG tumour regression grade. 1Cox’s regression; 2Fisher’s exact test (overall).

