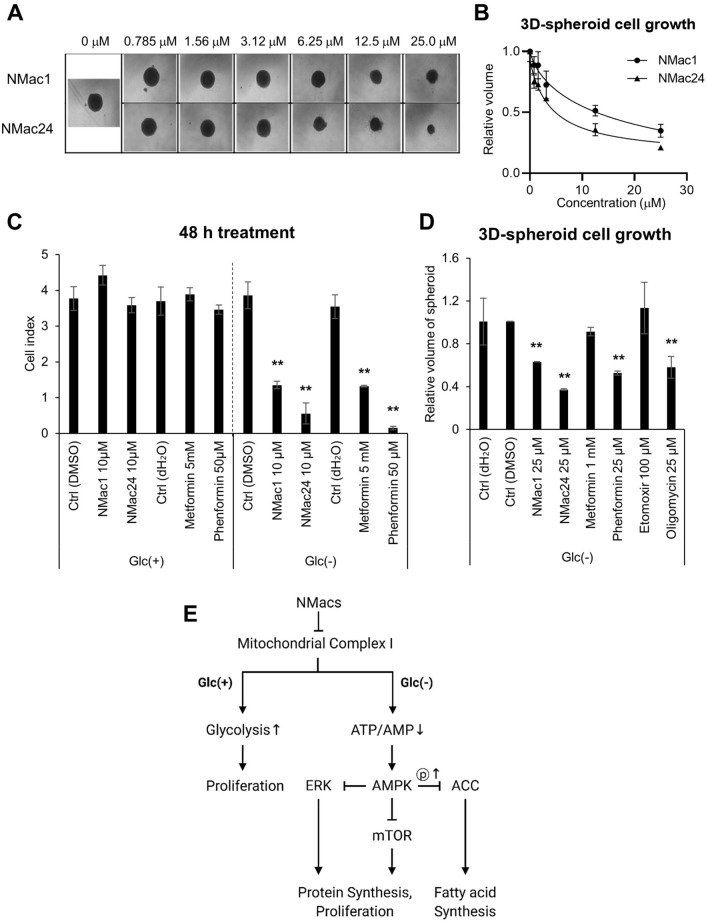
Figure 8.
Effect of NMac1 and NMac24 on 3D spheroid cell proliferation. (a) Representative images and (b) relative volume of three-dimensional (3D) spheroid cell proliferation. MDA-MB-231 cells were seeded in 2.5% matrigel, then after initiation, NMac1 and NMac24 were treated. Each spheroid size was measured after 2 weeks of chemical treatment. Error bars represent SD (n = 3). (c) Cell index using xCELLigence RTCA and (d) relative volume of 3D spheroids were measured after indicated concentrations of chemical treatment under glucose starvation for 48 h and 2 weeks, respectively. Error bars represent SD (n = 3). *p < 0.05, **p < 0.01. (e) Scheme of NMacs’ action on anti-proliferation. NMacs represent NMac1 and NMac24.

