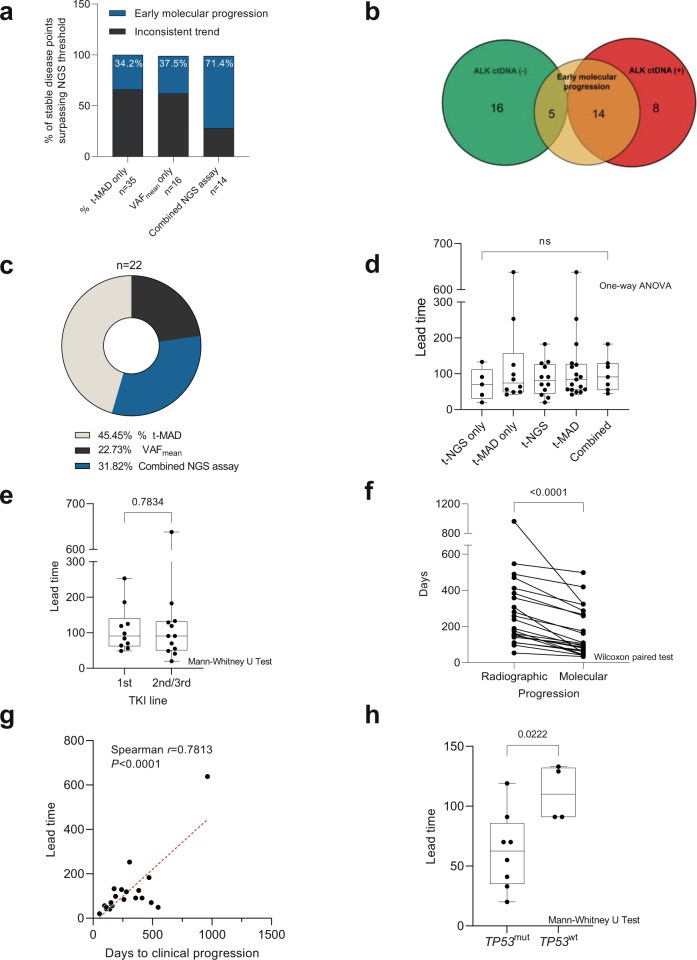
Fig. 3. Evaluation of the utility of ΔVAFmean and %Δt-MAD in identifying early molecular progression.
a Number of stable disease points that surpassed the numerical cutoffs per individual NGS assay (%Δt-MAD or ΔVAFmean) and in combination. Gray stacks indicate the percentage of points with inconclusive NGS assay values leading to clinical progression. Blue stacks represent points that showed sustained %Δt-MAD and/or ΔVAFmean increase leading to clinical progression, indicating early molecular progression. b Patients identified with early molecular progression were enriched in the ALK ctDNA (+) group. c Breakdown of 22 patients with early molecular progression based on NGS assays. d Comparison of called lead times based on NGS assays. e Comparison of called lead times based on therapy lines. f Comparison of cases with called lead time showing significant difference in days to radiographic progression versus molecular progression. g Length of lead time per therapy line was significantly correlated with duration of progression-free response to the respective treatment. h Lead times in cases with wild-type TP53 (TP53wt) were significantly longer compared to cases with mutated TP53 (TP53wt) detected by tNGS. The box plot show the the median, upper quartile, and lower quartile values. The whiskers indicate minimum and maximum values.

