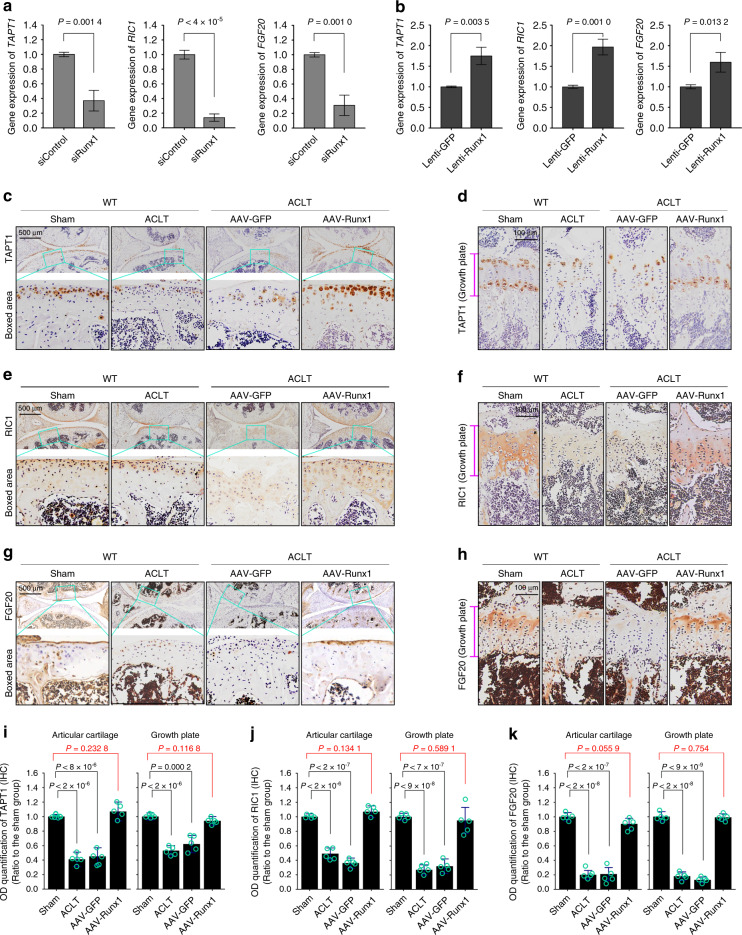
Fig. 7.
The expression of target candidates in cartilage. a qPCR results showing changes in TAPT1, RIC1, and FGF20 in chondrocytes induced by siRunx1. b qPCR results showing changes in TAPT1, RIC1, and FGF20 in chondrocytes induced by Runx1 overexpression. c, d IHC staining showing AAV-Runx1 overexpression-induced changes in TAPT1 expression in articular cartilage at 12 weeks after ACLT surgery (a) and the growth plate at 24 weeks after ACLT surgery (b). e–f IHC staining showing AAV-Runx1 overexpression-induced changes in RIC1 expression in articular cartilage at 12 weeks after ACLT surgery (a) and the growth plate at 24 weeks after ACLT surgery (b). g–h IHC staining showing AAV-Runx1 overexpression-induced changes in FGF20 expression in articular cartilage at 12 weeks after ACLT surgery (a) and the growth plate at 24 weeks after ACLT surgery (b). i Optical density quantitative analysis showing changes in TAPT1 expression in articular cartilage and the growth plate. j Optical density quantitative analysis showing changes in RIC1 expression in articular cartilage and the growth plate. k Optical density quantitative analysis showing changes in FGF20 expression in articular cartilage and the growth plate. These results are based on at least three independent experiments (n = 3). All significance data presented in a, b, i, j, and k are based on two-tailed Student’s t-tests

