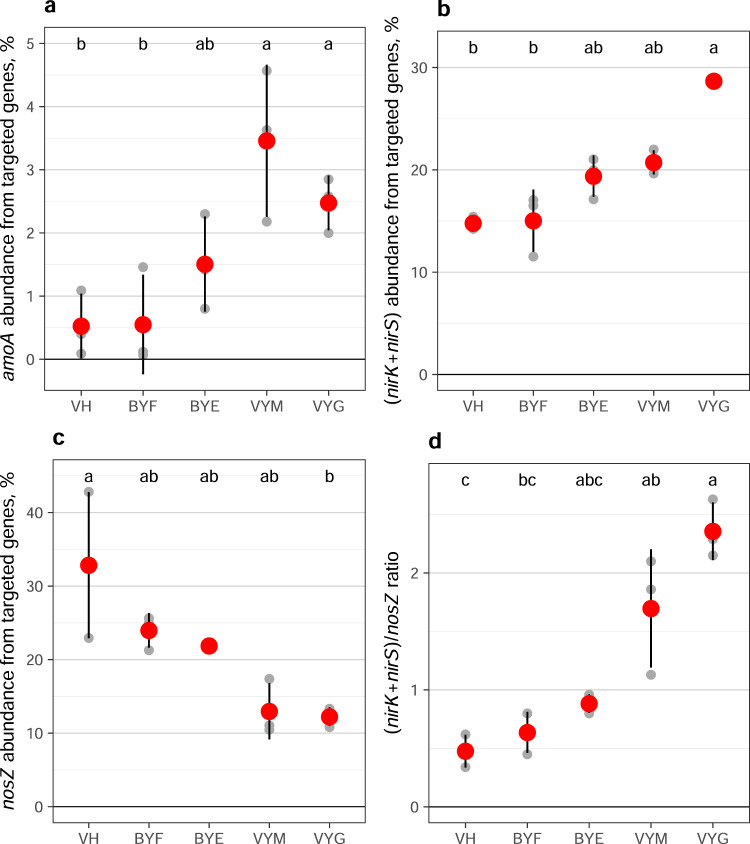
Fig. 4. Relative abundance of selected N cycling genes at the Kurungnakh exposure from all functional gene sequences captured with the targeted metagenomics tool.
a Relative abundance of amoA gene (including bacterial and archaeal). b Relative abundance of nir gene (including both nirK and nirS). c Relative abundance of nosZ gene. d Ratio of (nirK + nirS)/nosZ genes. The studied surfaces are arranged according to the distance from the Yedoma cliff border, with intact Holocene cover on the top of the Yedoma exposure on the left and earliest thawed revegetated Yedoma on the right side. Small gray symbols indicate values for individual samples, large red symbols indicate means, and error bars indicate standard error of mean (n = 3 biologically independent samples). Lower case letters indicate significant differences between studied soils (Kruskal-Wallis test with pairwise comparisons with Dunn’s test; unadjusted p < 0.05). VH Vegetated Holocene cover, BYF Bare freshly thawed Yedoma, BYE Bare earlier thawed Yedoma, VYM Yedoma revegetated with mosses, and VYG Yedoma revegetated with grasses.

