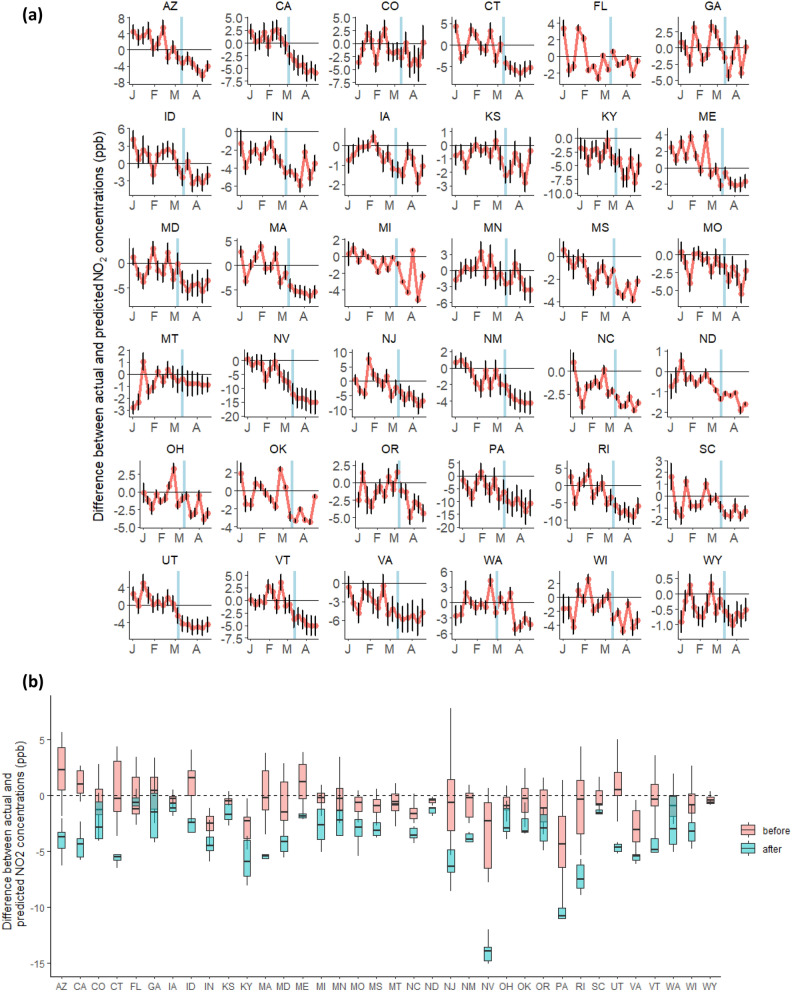
Figure 1.
(a) Weekly deviations between observed NO2 concentrations and counterfactual predictions (e.g., absent the pandemic) for each state. The counterfactual predictions were made for 16 weeks from January 1 to April 23, 2020. The blue vertical line marks the date of the declaration of a state of emergency in each state. (b) Boxplots of the weekly deviations for the weeks before (pink) and for the weeks after (blue) the date of the declaration of a state of emergency in each state.

