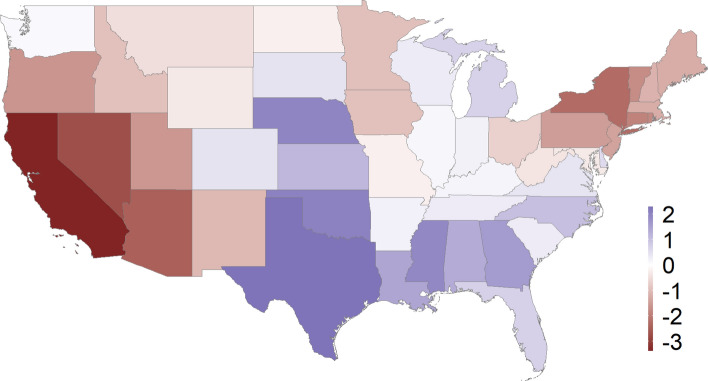
Figure 3.
Median change in PM2.5 following the state-level emergency declaration for each state (). A negative estimated value of indicates that air pollution levels declined as a result of the state-level emergency declaration. This figure was created using open source software R 4.1.0 (https://cran.r-project.org/). The base US map was used by using the R package: rnaturalearthhires (). The source code (Rcode_PM25_USmap_figure3.R) to recreate this figure, please visit our GitHub page: https://github.com/NSAPH/USA-COVID-state-level-air-pollution-SARIMA-analysis.

