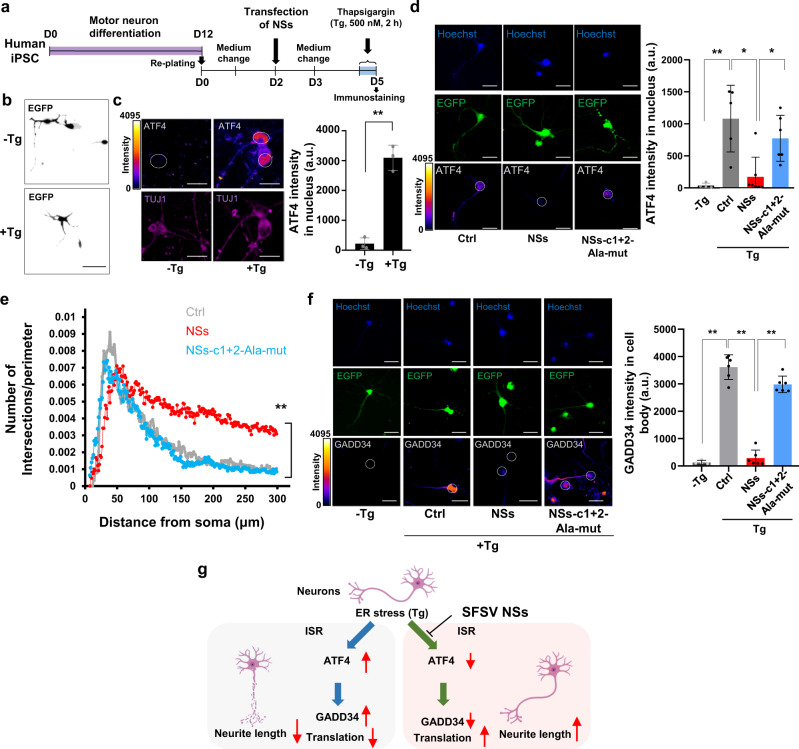
Fig. 6. SFSV NSs in human iPS cell-derived motor neurons attenuates the ISR induction and exhibits neuroprotective effects.
a Motor neuron differentiation from human iPS cells and the timing of NSs transfection and drug administration. After motor neurons were replated onto glass coverslips, they were transfected with the control plasmid, the SFSV NSs-expression plasmid, or the SFSV NSs-c1 + 2-Ala-mut-expression plasmid by Lipofectamine 3000 for 2 days. After additional 3 days, the neurons were treated with thapsigargin (Tg; 500 nM) for 2 h, followed by fixation and immunostaining of ATF4. b Representative images of motor neurons with or without Tg treatment. Scale bar = 50 µm. c Tg significantly induced the stress response, as represented by ATF4 upregulation in motor neurons. n = 3. Scale bar = 10 µm. **p < 0.01. d ATF4 intensity in control, SFSV NSs-expressing, and SFSV NSs-c1 + 2-Ala-mut-expressing motor neurons after Tg treatment. In SFSV NSs-expressing motor neurons, ATF4 was significantly downregulated, whereas mutant SFSV NSs expression did not alter ATF4 protein levels as compared to the control. n = 3. *p < 0.05. Scale bar = 10 µm. e Sholl analysis in motor neurons. NSs expression increased the length of axons as compared to the control and NSs-c1 + 2-Ala-mut expression. n = 5. f ISR triggered a significant increase of immunoreactivity to the GADD34 antibody. In addition, NSs treatment significantly decreased the expression level of GADD34, whereas NSs-c1 + 2-Ala-mutant did not alter the GADD34 level as compared to the control. n = 5. Scale bar = 10 µm. g Illustration of ISR induction and NSs effect upon ER stress in neurons. n means the number of independent experiments *p < 0.05; **p < 0.01. h Student’s t-test; d–f One-way ANOVA with Tukey’s multiple comparisons test. Error bars ±SD. c, d, f a.u., arbitrary units. The 12-bit scale of fluorescent intensity is shown at color coded. Source data are provided as a Source Data file.

