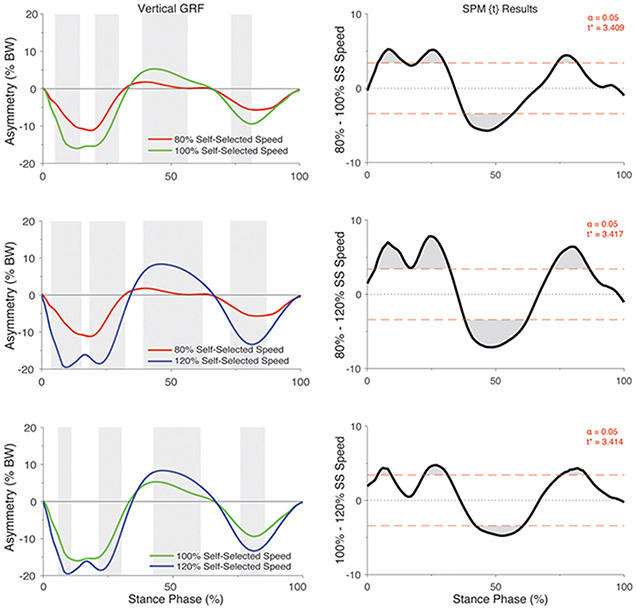
Figure 3.
SPM[t] Post hoc paired t-tests showing the effect of walking speed on asymmetry in vertical GRF (asymmetry: % BW) for individuals with ACL reconstruction. For column 1, positive values represent higher vertical GRFs in the injured relative to the contralateral limb whereas negative values indicate lower vertical GRFs in the injured relative to the contralateral limb. Shaded regions in column 1 correspond to significant regions identified in the SPM [t] results in column 2. For each SPM [t] graph, the red dashed line corresponds to the critical t thresholds, denoted as t*. Any portion of the waveform exceeding this threshold (shaded in grey) indicates a significance difference between speeds p < 0.05. SS = Self-selected speed.

