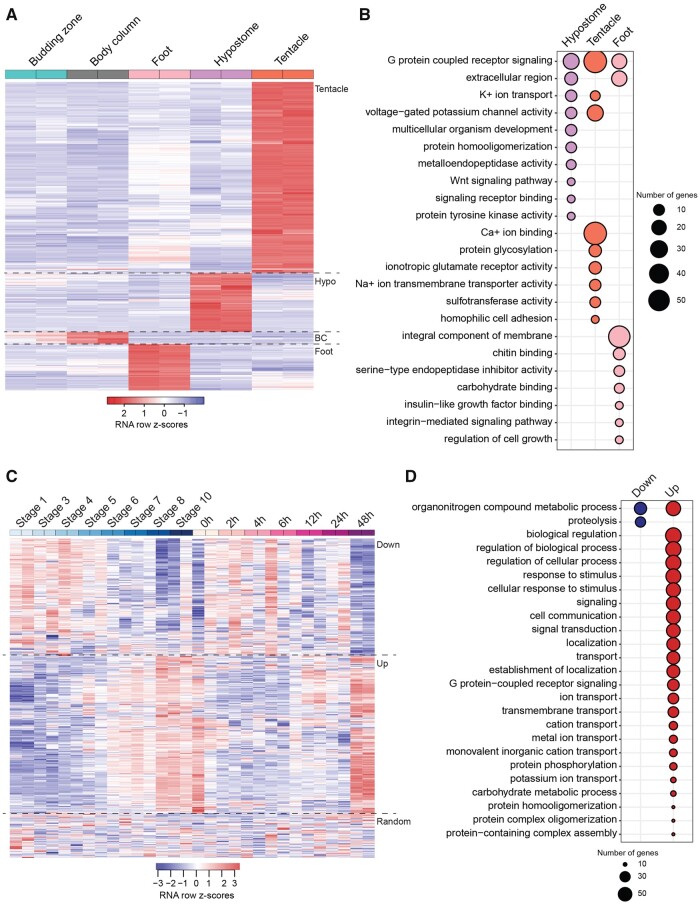
Fig. 2.
Heatmaps and functional enrichment of DE genes in the Hydra body map. (A) Heatmap showing clusters of genes upregulated in the tentacles, hypostome (hypo), BC, and foot. Only one gene was uniquely upregulated in the budding zone and is therefore not visible on the heatmap. (B) Functional enrichment of genes upregulated in the hypostome, tentacles, and foot. There was no significant enrichment for genes upregulated in the BC and budding zone. (C) Heatmap and grouping of the DE genes in the hypostome versus budding zone. Group 1 (Down) shows genes that decrease in expression during the stages of budding and time points of regeneration. Group 2 (Up) shows genes that increase in expression during budding and regeneration. Group 3 is the remainder of the genes with no trends in budding or regeneration. Although shown together, z scores were calculated separately for budding and regeneration. (D) Functional enrichment of genes in group 1 and group 2 of figure 2C. There was no significant functional enrichment for genes in group 3.

