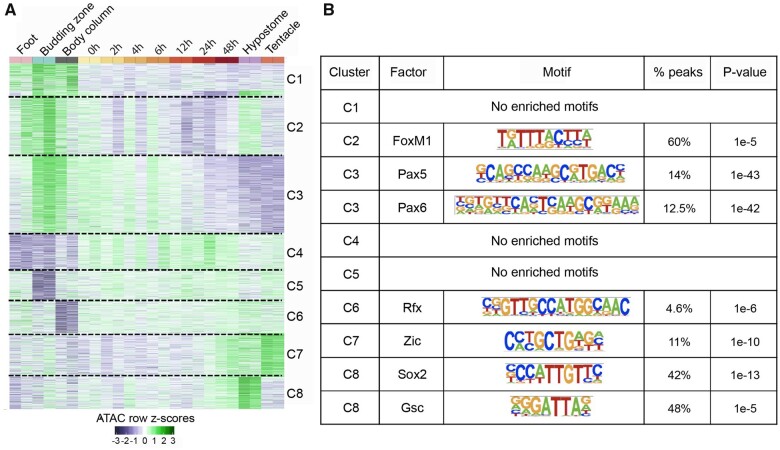
Fig. 5.
Dynamics and motif analysis of 2,870 DA peaks. (A) Normalized reads per million (RPM) values for the 2,870 DA peaks were converted to row z scores and k-means clustered into eight clusters based on the observed number of clusters when hierarchically clustered. (B) Transcription factor-binding motifs enriched in open chromatin regions of each cluster in figure 5A.

