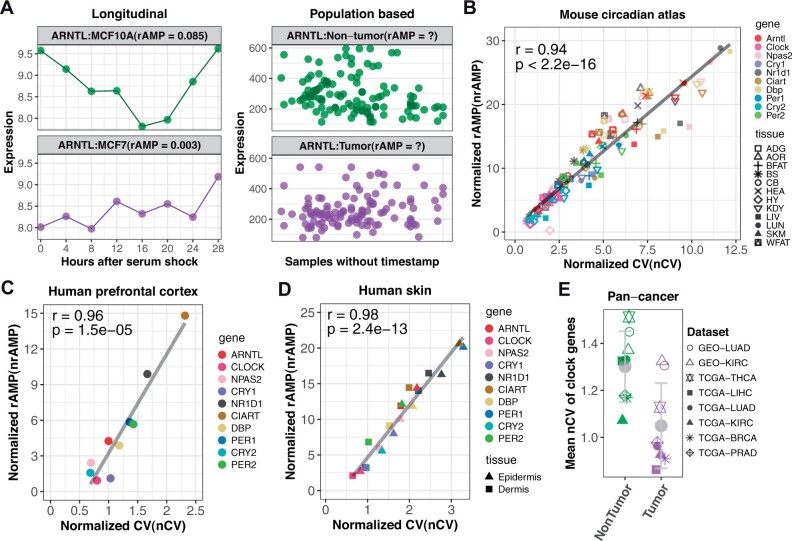
Fig. 1.
nCV measures clock robustness. (A) rAMP is uninformative when comparing human breast tumors versus adjacent nontumor samples without labeled time. nCV of 10 clock genes is linearly correlated with nrAMP in mouse tissues (B), in human prefrontal cortex samples with labeled time (C) and in CYCLOPS ordered human epidermis and dermis samples (D). (E) The mean nCV of 10 clock genes from nontumor (green) and tumor samples (purple) per dataset (Supplementary Table S1). Gray point represents the average value in nontumor or tumor group, with error bar indicating ±SD (Color version of this figure is available at Bioinformatics online.)

