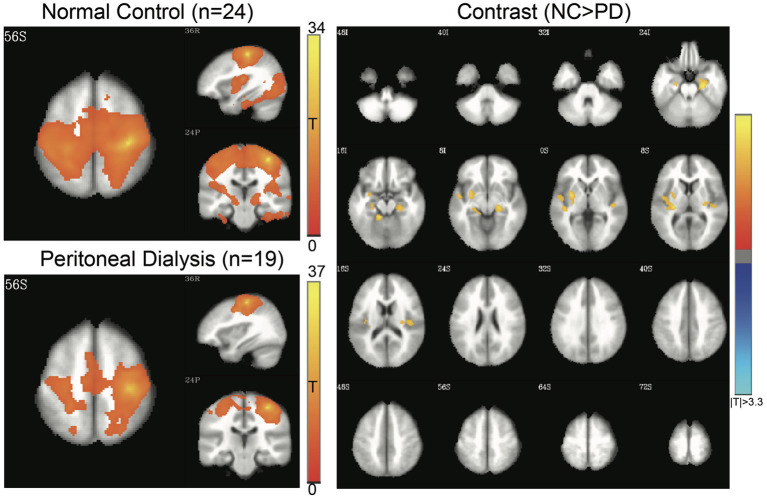
Figure 3.
Sensorimotor network (SMN) of controls and patients with PD. Connectivity map of either group is shown at the left side (FWE-corrected p < 0.05), and the contrast map at the right side (3dClustSim-corrected p < 0.05). In the contrast map, the orange color represents significantly increased connectivity in controls, including parahippocampal gyrus and insula. PD, peritoneal dialysis; NC, normal controls.

