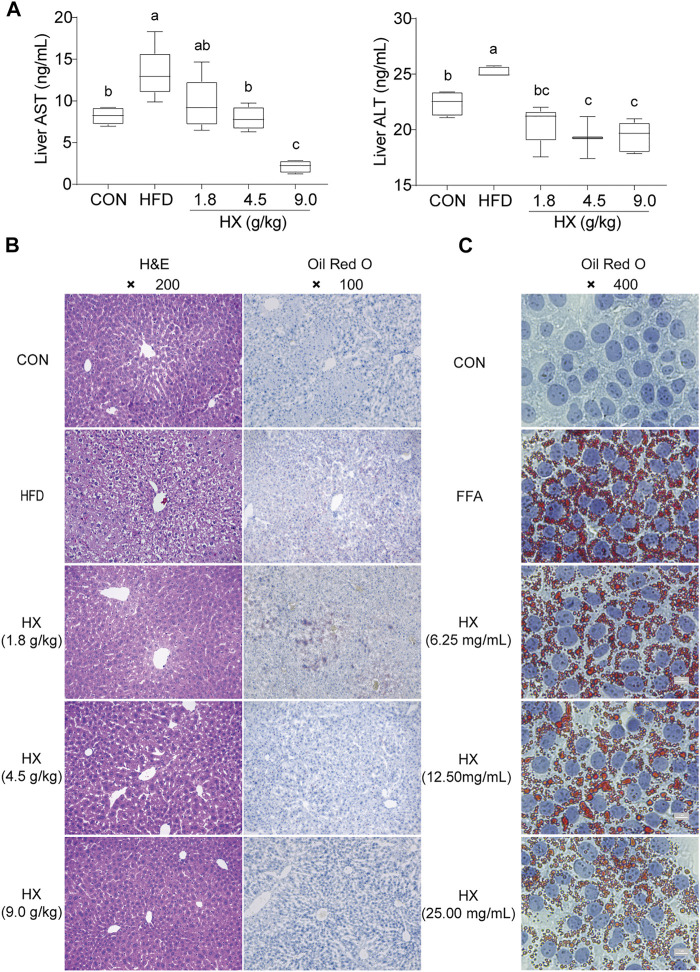
FIGURE 5.
(A) Concentrations of ALT and AST (B) H&E and Oil-Red-O staining in the liver tissue of mice after 8 weeks of HFD feeding, and (C) Oil-Red-O staining in AML12 cells incubated without or with FFA and different concentrations of HX (6.25, 12.50, and 25.00 mg/ml). A one-way ANOVA was used to analyze data, and multiple comparisons were employed, and the results are expressed as the mean ± SEM (n = 6 per group). Statistical analyses were performed using Student’s t-test. Different lowercase letters a, b and c denote significant differences between any two groups (p < 0.05), but with the same lowercase letters, like bc and c, ab and a or b means no differences between the two groups (p > 0.05). ALT, alanine aminotransferase; AST, aspartate aminotransferase; CON, control; HFD, high-fat diet; FFA, free fatty acid; HX, Huo Xiang.

