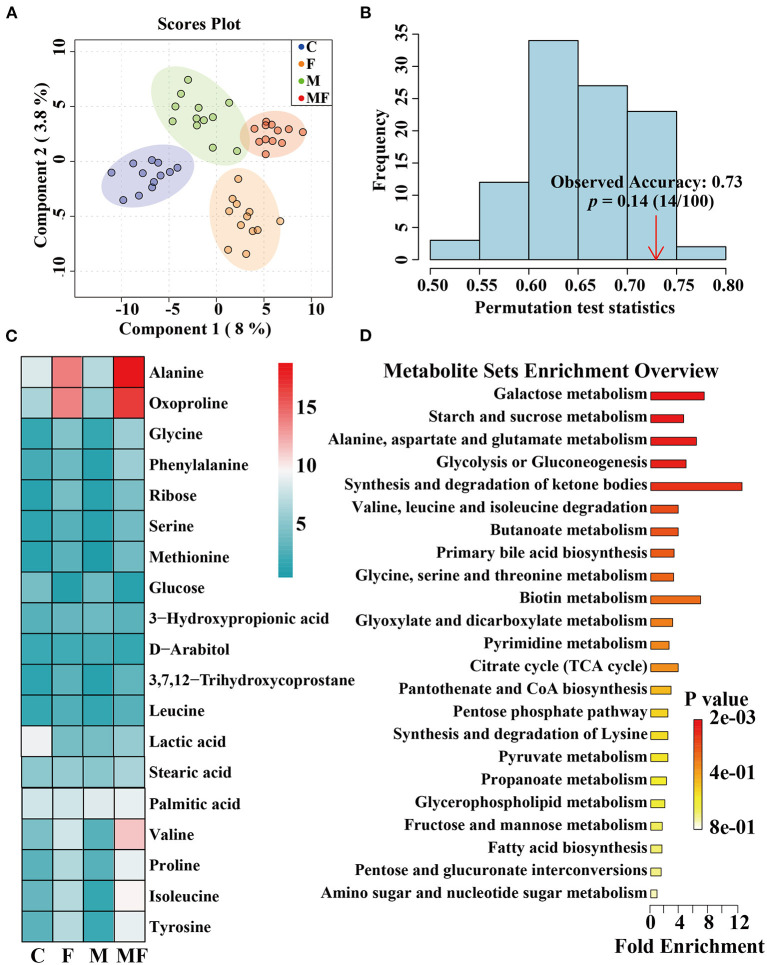
Figure 8.
The effects of intermittent fasting and melatonin supplementation on intestinal metabolites in mice. (A) Score plot from and PLS-DA of metabolite profiles of the intestinal contents of mice between all groups. Each data point represents a function of the entire spectral profile of each subject; (B) The permutation test was evaluated based on the corresponding PLS-DA model. (C) A heatmap of significantly altered metabolites in the intestines of mice between all groups. (D) Metabolic pathways related to each metabolite. Data are presented as mean ± SEM, n = 12. C, control; F, intermittent fasting; M, melatonin; MF, intermittent fasting plus melatonin. The C and M mice were fed ad libitum, while the F and MF groups underwent alternative-day feed deprivation. The M and MF groups mice were supplemented with melatonin at a dose of 10 mg/kg body weight by drinking.

