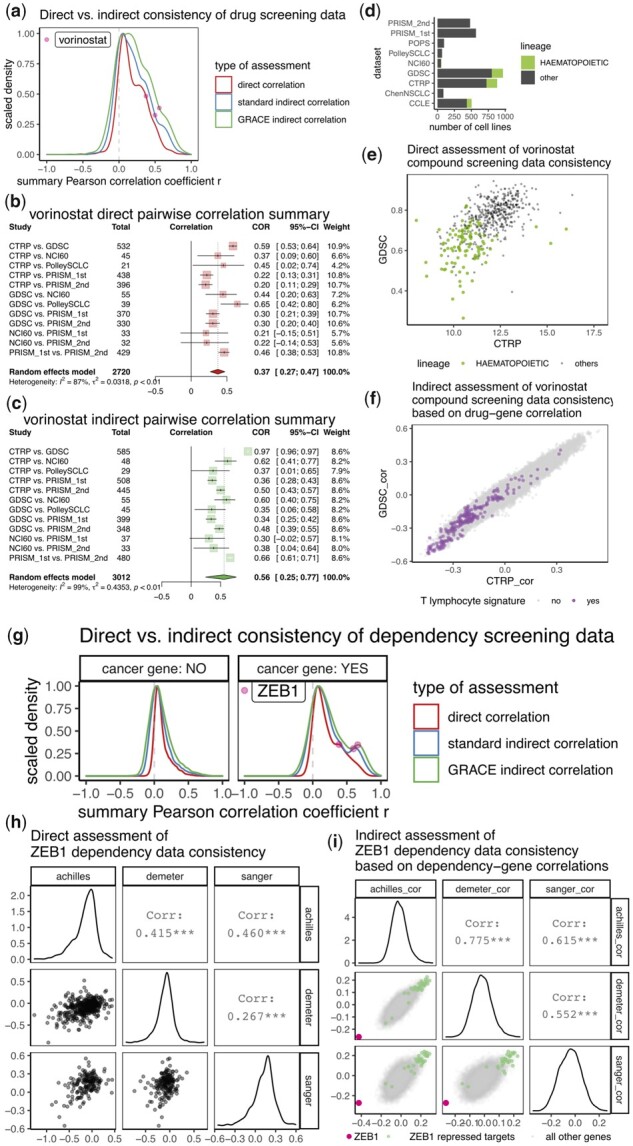
Fig. 4.

Comparison of direct and indirect assessment on functional screening datasets. (a) Density plot showing distribution of direct indirect consistency measures on 1707 compounds for inter-study consistency assessment. For indirect assessment, standard method uses RNA-seq expression data whereas GRACE method uses copy number-adjusted RNA-seq expression data. For each distribution, density was scaled to have maximum of 1. (b,c) Forest plots showing meta-analysis of inter-study consistency for vorinostat by direct (b) or indirect (c) assessment. While sample sizes for direct assessment were determined as the number of overlapping cell lines with non-missing functional data, the sample sizes for indirect assessment were determined as the number of overlapping cell lines with copy number-adjusted gene expression data. Note that pairwise correlation for CTRP versus GDSC increased from 0.59 in (b) to 0.97 in (c). (d) Number of cell lines belonging to hematopoetic or other cancer lineages for the nine compound screening datasets. (e) Scatterplot showing compound screening data (area under the dose response curve, AUC, lower value corresponds to higher sensitivity) for vorinostat from CTRP and GDSC. Cell lines with hematopoetic lineage are plotted as green dots. (f) Scatterplot showing values of correlation coefficients from association between vorinostat AUC data (from GDSC or CTRP) and copy number-adjusted transcriptomic data. Genes mapped to a T lymphocyte gene signature from ‘LEE_DIFFERENTIATING_T_LYMPHOCYTE’ (Lee et al., 2004) were plotted as purple dots. (g) Density plot showing distribution of direct indirect consistency measures on 17 966 genes for inter-study consistency assessment. Assessments were made separately for cosmic defined oncogenes and all other genes. (h) Scatterplot matrix showing relationship among gene effect data (lower value corresponds to higher lethality) for ZEB1 from all three dependency datasets. (i) scatterplot matrix showing values of correlation coefficients from association between ZEB1 deactivation effect data and copy number-adjusted transcriptomic data. Datapoints for ZEB1 and ZEB1 repressed targets were colored. In both (f) and (i), negative correlations suggest higher gene expression is associated with higher sensitivity
