Fig. 5.
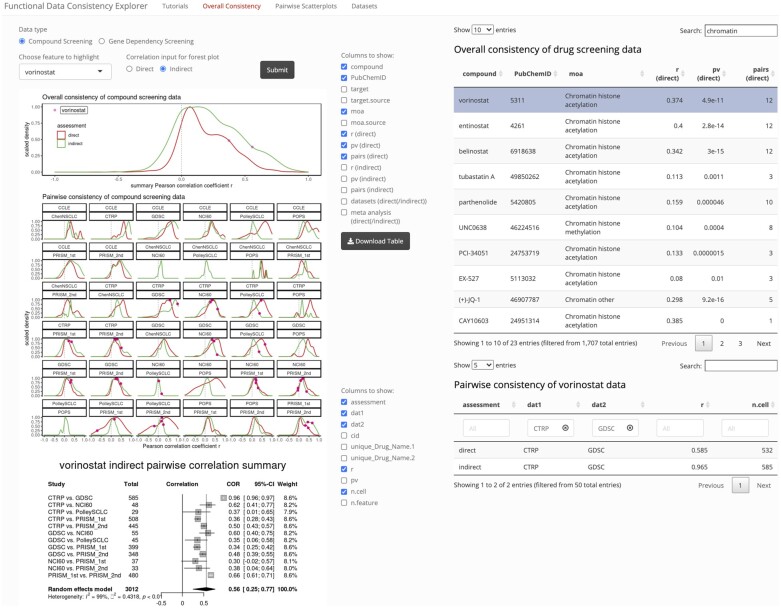
Snapshot taken from the FDCE web application for assessment of compound data consistency. Under the ‘Overall Consistency’ tab panel, users may choose to assess data consistency for compound or dependency screening data. Both distribution of direct and indirect (by GRACE method) assessment results are visualized. The top density plot panel represents distribution of ‘r.summary’, summarized from all inter-study correlations, whereas the bottom panel with multiple subplots visualizes distribution for each study pair. Upon submission of a feature to highlight and specification of the type of input pairwise correlation for meta-analysis, the datapoints corresponding to the inter-study correlation coefficients associated with the feature of interest are added to the plots and a forest plot showing results from meta-analysis will be shown below. On the right side of the web page, the top table lists the consistency summary statistics for all overlapping features across the dataset, as well as additional information about the features. Left of the table are column options for display. In this particular table, as vorinostat is a HDAC inhibitor, we checked to display the ‘moa’ and searched ‘chromatin’ as a keyword to identify additional compounds with similar moa. The bottom table contains pairwise correlation results for all study pairs specific to the feature of interest and is only rendered when user submits a feature to highlight. Annotations for column names in overall consistency table for drug screening data: ‘target’, the drug target; ‘target.source’, the source of ‘target’ annotation; ‘moa’, mechanism of drug action; ‘moa.source’, source of ‘moa’ annotation; the ‘direct’ statistics are from direct correlations of functional screening data; the ‘indirect’ statistics are from correlations of correlations between copy number-adjusted gene expression data and functional screening data; ‘pairs’ refer to the number of dataset pairs for which correlation was calculated; ‘meta-analysis’ indicates whether the feature-specific statistics is based on meta-analysis. Annotations for column names in pairwise consistency table for a specific drug: ‘cid’, PubChem ID; ‘unique_Drug_Name.1’ or ‘unique_Drug_Name.2’, compound name used for ‘dat1’ or ‘dat2’, note that when replicates exist for the same study, these names will end with ‘(n)’; ‘n.cell’, number of cell lines in the pairwise correlation; ‘n.feature’, number of features overlapping for the two datasets

