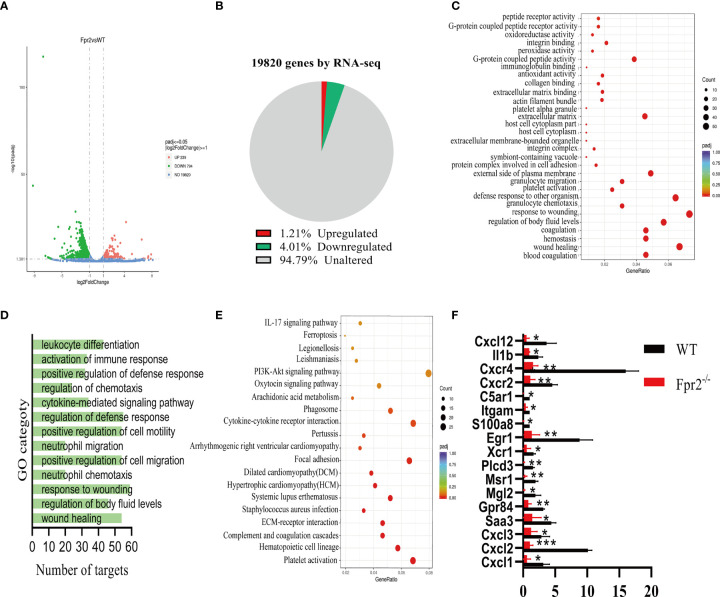
Figure 4.
RNA-seq analysis of Fpr2-modulated genes. (A) A volcano plot illustrating differentially regulated gene expression from RNA-seq analysis between WT and Fpr2-/-. Genes upregulated and downregulated are shown in red and green, respectively. Values are presented as the log2 of tag counts. (B) RNA-seq comparison revealed a total of 1033 genes expressed, of which 239 genes were upregulated and 794 genes were downregulated. (C) KEGG pathway analysis of downregulated targets in Fpr2-deficient transcriptome. (D, E) Gene ontology (GO) functional clustering of genes that were downregulated for biological processes. (F) qPCR validation analysis of the indicated genes regulated by Fpr2. Data are shown as mean ± SD. *P < 0.05, **P < 0.01, ***P < 0.001.

