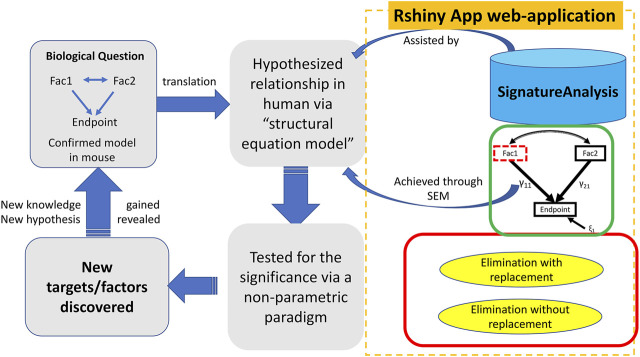
FIGURE 1.
The workflow and application of SEMIPs. The left four rectangles and arrows indicate our hypothesis testing and generation schema; the components bounded by the dotted orange rectangle are features provided in the Rshiny App web-application. A biological hypothesis is tested in a model system (i.e. mouse) on relationship between two interacting factors (Fac1 & Fac2) and their endpoint through a 3-node SEM model indicated by the green rectangle. The hypothesis is translated to another species (i.e., human in our research) via T-score computation (represented by the upper blue arrow noted as “assisted by”) and verified with the SEM model (represented by the lower blue arrow noted as “achieved through SEM”). This process is accomplished with our R Shiny app indicated by two curved arrows. γ 11 and γ 21 are correlation coefficients and ξ1 is the model residual. The two-class bootstrap resampling is shown in the red rectangle box. Hypothesis generating and exploring steps are explained by the bottom two rectangles.

