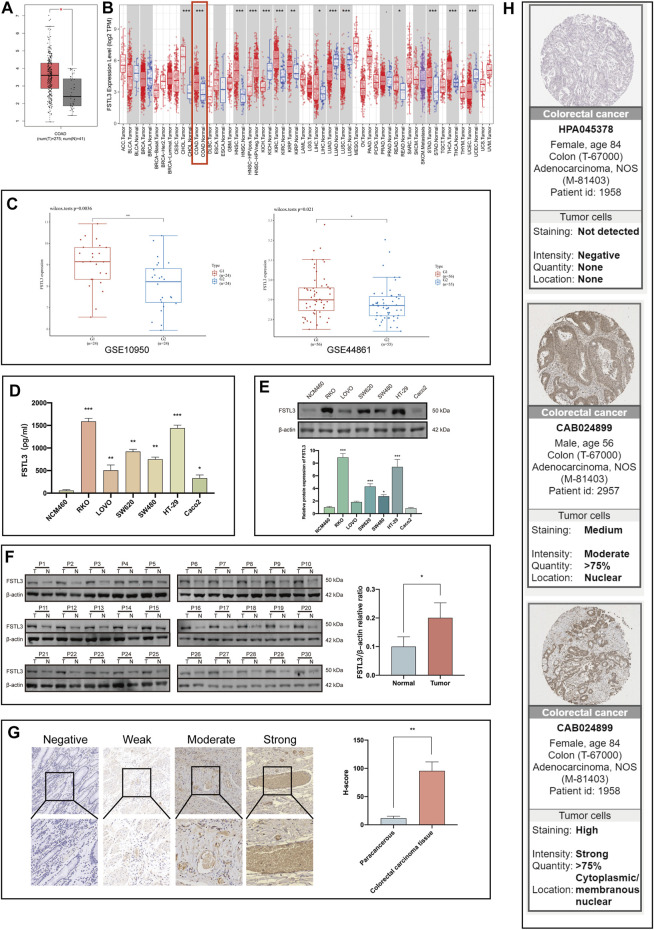
FIGURE 1.
FSTL3 levels in the colorectal cancer (CRC) tissues. (A) Expression levels of FSTL3 in CRC based on the data of the Cancer Genome Atlas (TCGA)-COAD. (B) The FSTL3 mRNA levels in the CRC and normal tissues based on the TIMER database. (C) Public datasets from the Gene Expression Omnibus (GSE10950, GSE44861) were used to verify the FSTL3 mRNA levels in CRC. (D,E) The FSTL3 protein expression in the normal human colonic epithelial cells as well as the CRC cells. (F) FSTL3 expression in the CRC tissues (T) and paired non-tumorous tissue (N) evaluated using western blotting (n = 30). (G) The intensity of FSTL3 immunohistochemistry staining and FSTL3 expression levels in the paracancerous and CRC tissues (n = 30). (H) The FSTL3 immunohistochemistry in the CRC tissues is based on data from the Human Protein Atlas (THPA). * p < 0.05, ** p < 0.01, *** p < 0.001.

