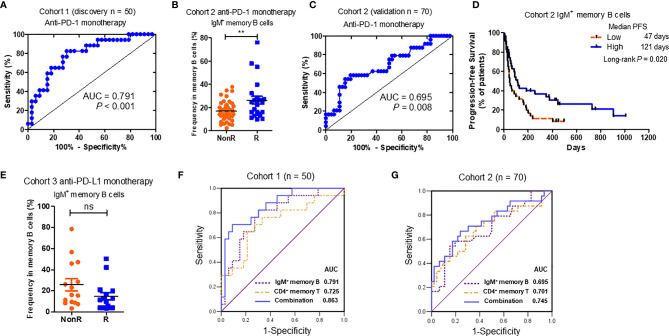
Figure 4.
Significance of baseline IgM+ memory B cells in predicting the response to anti-PD-1 monotherapy. (A) The Receiver Operating Characteristic (ROC) analyses of IgM+ memory B cell percentages in discovery cohort (cohort 1 in Table 1 , n = 50). (B) Comparison of the percentages of IgM+ memory B cells between R (n = 24) and NonR (n = 46) advanced NSCLC patients with anti-PD-1 monotherapy in an independent validation cohort (cohort 2 in Table 1 , n = 70). (C) The ROC analysis of IgM+ memory B cell percentages in validation cohort (cohort 2 in Table 1 , n = 70). (D) The Kaplan-Meier analysis of the associations of the percentages of IgM+ memory B cells with the PFS in cohort 2. (E) Comparison of the percentages of IgM+ memory B cells between R (n = 15) and NonR (n = 15) advanced NSCLC patients with anti-PD-L1 monotherapy in an independent validation cohort (cohort 3 in Table 1 , n = 30). (F, G) The ROC analyses of baseline CD19+ memory B combined with CD4+ memory T cell percentages in discovery cohort 1 (F) and validation cohort 2 (G). The Wilcoxon test was used to analyze the differences between two groups. Survival curves were plotted by using the Kaplan-Meier method using median as the cutoff to define the high and low group. P-values were calculated by the log-rank statistics in Kaplan-Meier analyses. **P < 0.01, ns, P > 0.05.

