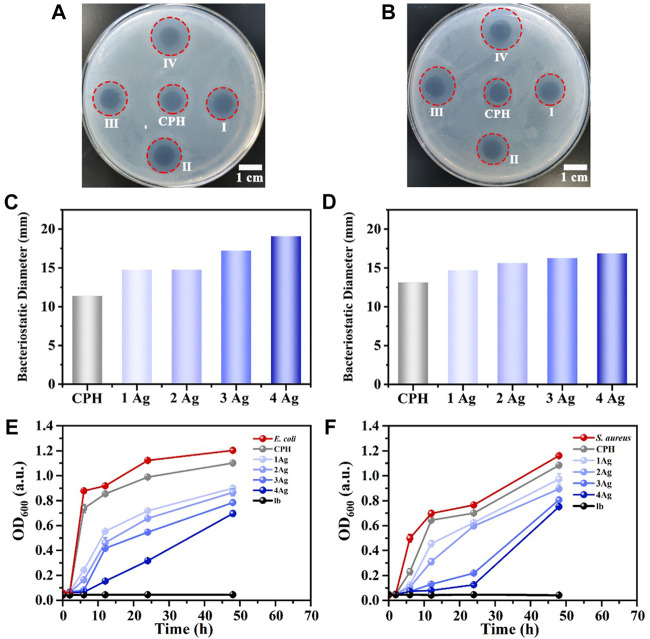
FIGURE 4.
(A,B) show the photos of the antibacterial plate experiment (E. coli and S. aureus) for Ag NPs/CPH. In the photos, I denotes the 1 Ag group, II denotes the 2 Ag group, III denotes the 3 Ag group, and Ⅳ denotes the 4 Ag group. (C,D) show the calculated diameter of the inhibition zone of the corresponding antibacterial plate experiment. (E) OD value diagram of the lb medium, CPH, E. coli solution, and E. coli cocultures with Ag NPs/CPH at different concentrations of Ag NPs (1 Ag, 2 Ag, 3 Ag, and 4 Ag) from 0 to 48 h. (F) OD value diagram of the lb medium, CPH, S. aureus solution, and S. aureus cocultures with Ag NPs/CPH at different concentration of Ag NPs (1 Ag, 2 Ag, 3 Ag, and 4 Ag) from 0 to 48 h.

