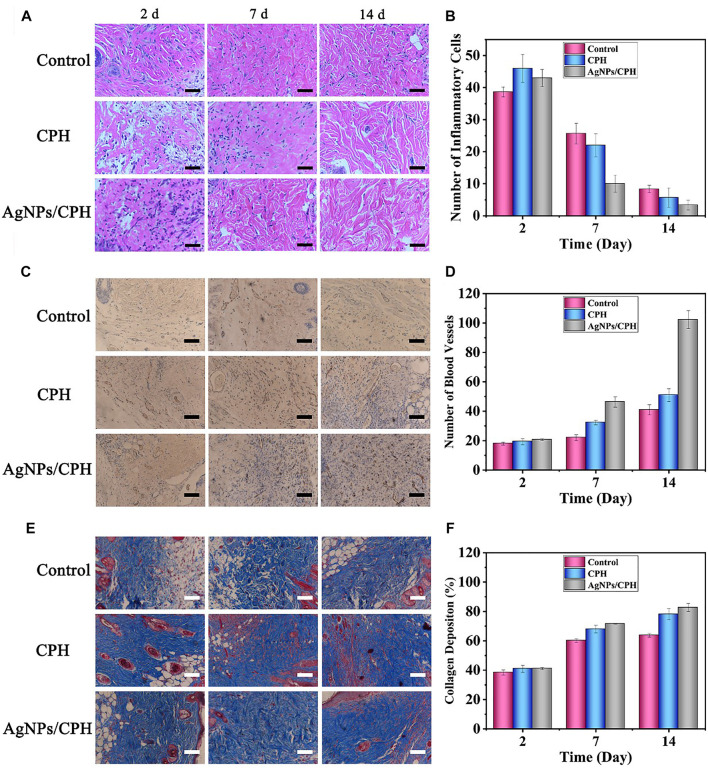
FIGURE 6.
(A) H&E-stained sections of skin tissue near the wound of mice treated with gauze (control group), CPH, and Ag NPs/CPH after 2, 7, and 14 days (scale: 50 μm). (B) Corresponding count of inflammatory cells. (C) CD31-stained sections of skin tissue near the wound of mice treated with gauze (control group), CPH, and Ag NPs/CPH after 2, 7, and 14 days (scale: 100 μm). (D) Corresponding count of blood vessels in Figure 6C. (E) Masson-stained sections of skin tissue near the wound of mice treated with gauze (control group), CPH, and Ag NPs/CPH after 2, 7, and 14 days (scale: 100 μm). (F) Corresponding percentage of collagen deposition in Figure 6E.

