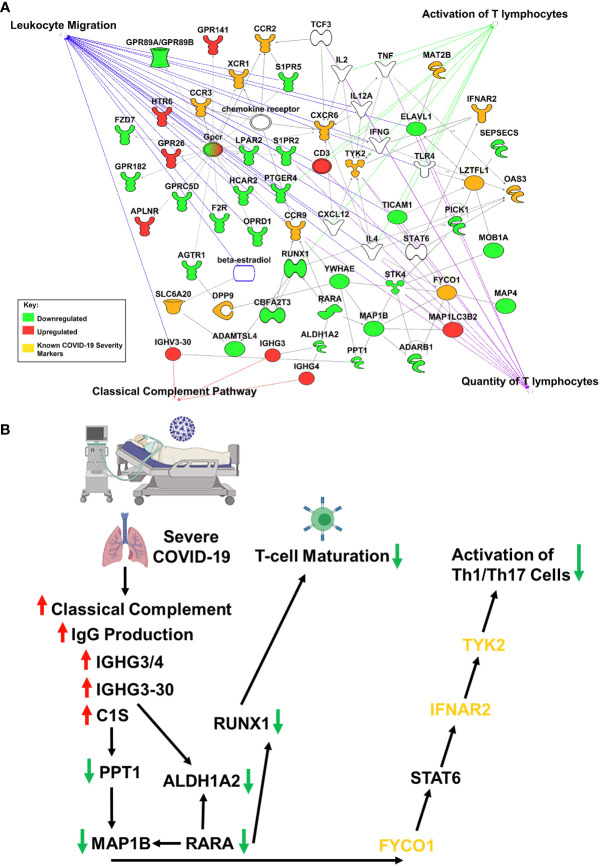
Figure 2.
IPA Network Analysis. (A) IPA generated network map showing known connections among the common genes found in both RNASeq datasets and the previously identified severe COVID-19 genetic susceptibility markers (SLC6A20, LZTFL1, CCR9, FYCO1, CXCR6, XCR1, DPP9, MAT2B, OAS3, TYK2, CCR2, CCR3, and INFAR2) with known pathways in IPA for cellular functions of interest. Genes are colored based on if the average gene expression between the two experiments showed upregulation (red) or downregulation (green). SLC6A20, LZTFL1, CCR9, FYCO1, CXCR6, XCR1, DPP9, MAT2B, OAS3, TYK2, CCR2, CCR3, and INFAR2 are all labeled in yellow. (B) COVID-19 causes upregulation of IgG production leading to activation of classical complement through C1S, which produces a downregulation of RUNX1 and TYK2 signaling, that blocks T-cell maturation and mutes Th1/Th17 immune response, respectively.

