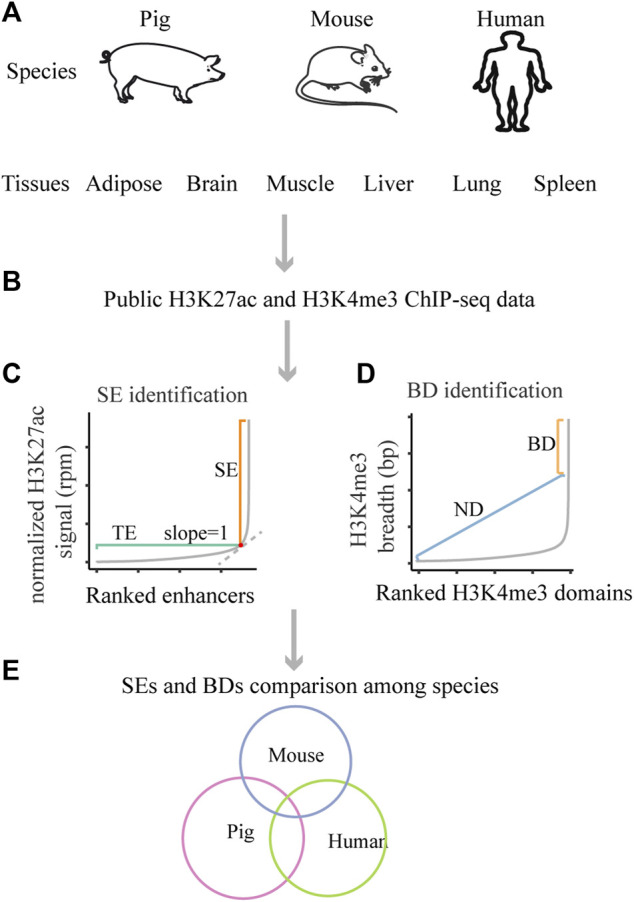
FIGURE 1.

Schematic of the design of this study. (A) The studied species and tissues. (B) The used public data. (C) The schematic for SEs identification. (D) The schematic for BDs identification. (E) The schematic for SEs and BDs comparison among pig, human and mouse.
