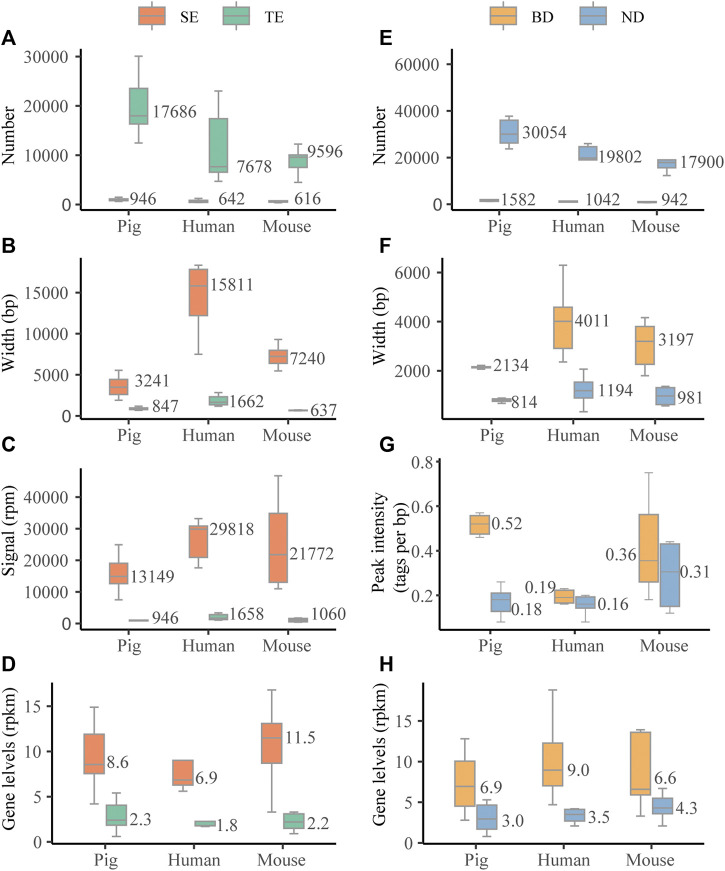
FIGURE 2.
Characterization of SEs and BDs. (A–D) The distribution of numbers, length (bp), signal levels (reads per million mapped reads, rpm), and associated gene levels (reads per million mapped reads per kilobase, rpkm) based on the median values of six tissues across three species. (E, F) The distribution of numbers, length (bp), peak signal intensity (tags per bp), and associated gene levels (rpkm) based on the median values of six tissues across three species.

