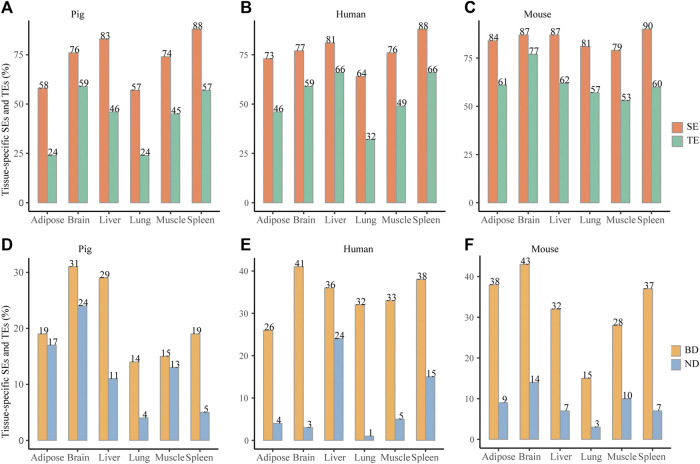
FIGURE 3.
Tissue specificity of SEs and BDs. (A–C) Distribution of the tissue-specific SEs and TEs for pig, human, and mouse, respectively. (D–F) Distribution of the tissue-specific BDs and NDs for pig, human, and mouse, respectively. *** represents p value <0.001 based on the Wilcoxon rank-sum test.

