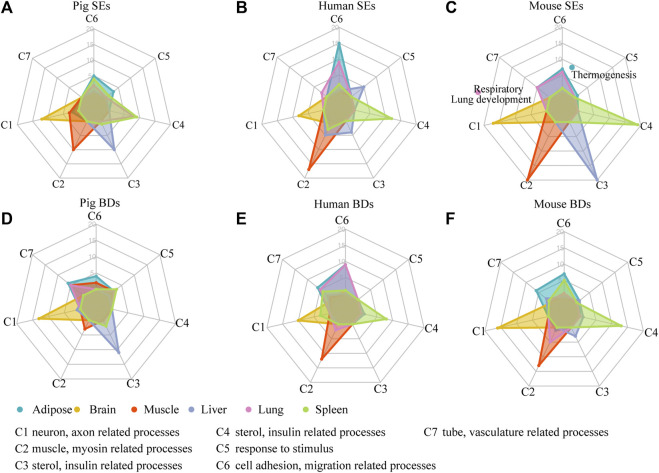
FIGURE 4.
Functional analysis of SEs and BDs. (A–C) Radar plots showing the number of enriched GO terms of SE-associated genes in seven categories for six pig, human, and mouse tissues, respectively. (D–F) Radar plots showing the number of enriched GO terms of BD-associated genes in seven categories for six pig, human, and mouse tissues, respectively. Note: The top 20 most significantly enriched GO terms are selected, and the details of the GO enriched terms and categories are provided in Supplementary Table S5.

