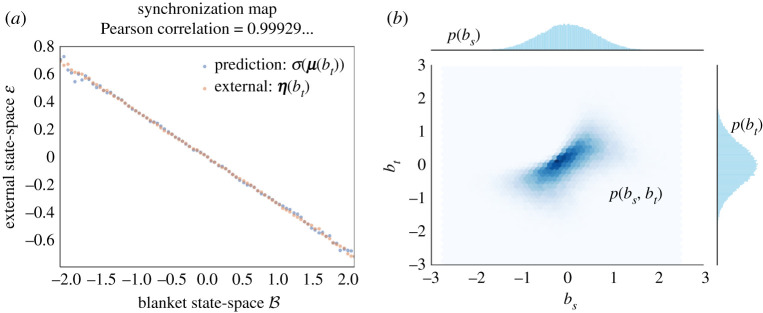
Figure 4.
Processes at a Gaussian steady state. This figure illustrates the synchronization map and transition probabilities of processes at a Gaussian steady state. (a) We plot the synchronization map as in figure 2, only, here, the samples are drawn from trajectories of a diffusion process (3.2) with a Markov blanket. Although this is not the case here, one might obtain a slightly noisier correspondence between predictions and expected external states —compared to figure 2—in numerical discretizations of a diffusion process. This is because the steady state of a numerical discretization usually differs slightly from the steady state of the continuous-time process [37]. (b) This panel plots the transition probabilities of the same diffusion process (3.2), for the blanket state at two different times. The joint distribution (depicted as a heat map) is not Gaussian but its marginals—the steady-state density—are Gaussian. This shows that in general, processes at a Gaussian steady state are not Gaussian processes. In fact, the Ornstein–Uhlenbeck process is the only stationary diffusion process (3.2) that is a Gaussian process, so the transition probabilities of nonlinear diffusion processes (3.2) are never multivariate Gaussians. (Online version in colour.)

