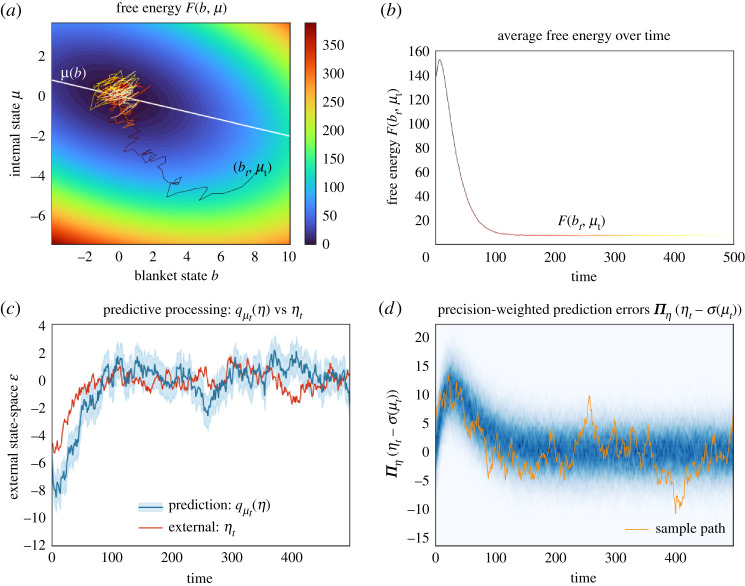
Figure 6.
Variational inference and predictive processing. This figure illustrates a system’s behaviour after experiencing a surprising blanket state. This is a multidimensional Ornstein–Uhlenbeck process, with one external, blanket and internal variable, initialized at the steady-state density conditioned upon an improbable blanket state . (a) This plots a sample trajectory of particular states as these relax to steady state over a contour plot of the free energy. The white line shows the expected internal state given blanket states, at which point inference is exact. After starting close to this line, the process is driven by solenoidal flow to regions where inference is inaccurate. Yet, solenoidal flow makes the system converge faster to steady state [60,61] at which point inference becomes accurate again. (b) This plots the free energy (up to a constant) over time, averaged over multiple trajectories. (c) We illustrate the accuracy of predictions over external states of the sample path from the upper left panel. These predictions are accurate at steady state (from timestep ). (d) We illustrate the (precision weighted) prediction errors over time. In orange, we plot the prediction error corresponding to the sample path in a; the other sample paths are summarized as a heat map in blue. (Online version in colour.)

