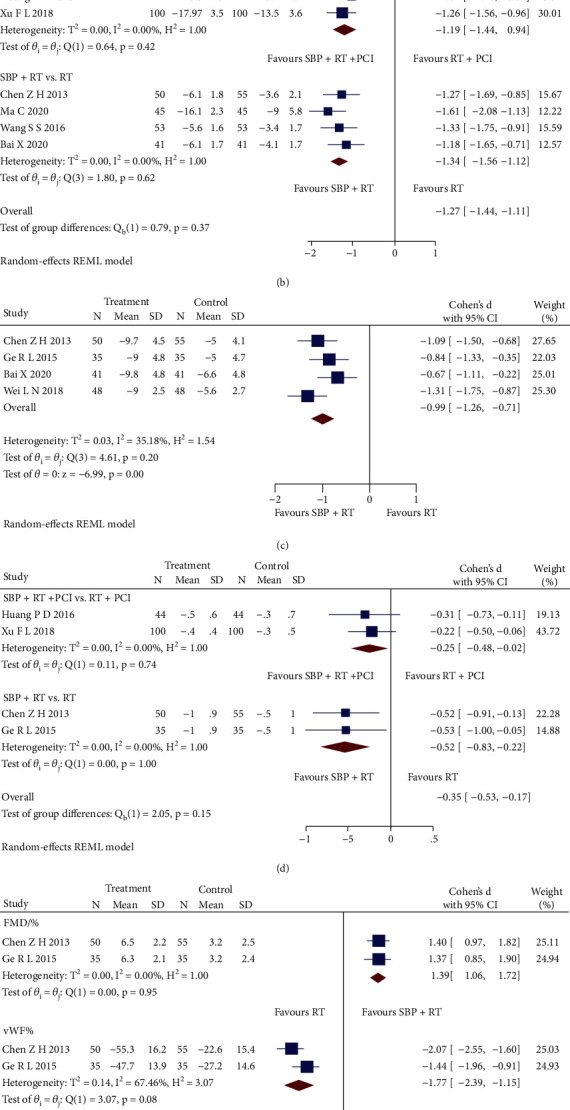
Figure 5.

(a) Forest plot of subgroup analysis on the CK-MB and cTnI. (b) Forest plot of subgroup analysis on the Hs-CRP. (c) Forest plot of pooled analysis on the IL-6. (d) Forest plot of subgroup analysis on the TG. (e) Forest plot of subgroup analysis on the FMD and vMF. (f) Forest plot of pooled analysis on the NO.
