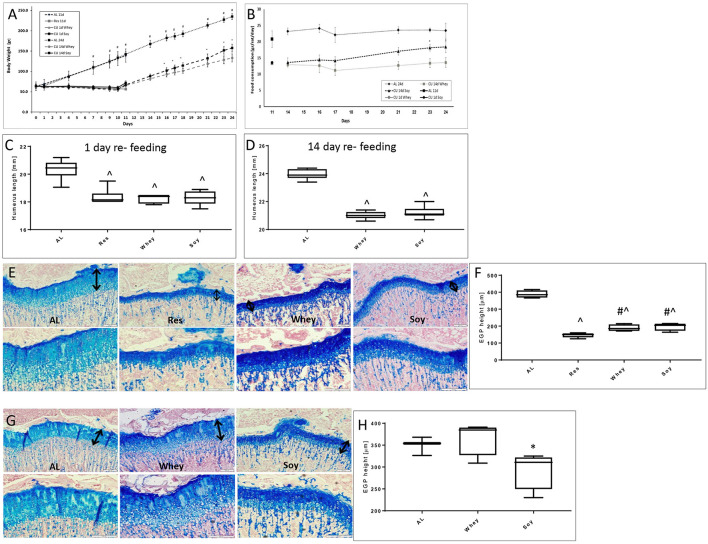
Figure 3.
Catch-up growth experiment. (A) Animal body weight, (B) food consumption, (C) humerus length 1 day refeeding, (D) humerus length 14 days refeeding, and (E) representative stained sections of the EGP at 1 day refeeding (upper panel magnification ×10; lower panel magnification X 20); (F) EGP height at 1 day of refeeding. (G) Representative stained sections of the epiphyseal growth plate (EGP) at 14 days refeeding (upper panel magnification ×10; lower panel magnification X 20). The black arrows indicate the height of the growth plates. (H) EGP height at 14 days refeeding. Statistical analysis was done by Student's T-test. The asterisk (*) within the graphs designates significant differences at p < 0.05 for soy vs. whey. The pound sign (#) within the graphs designates significant differences at p < 0.05 for Res vs. Whey/Soy; The caret sign (∧) within the graphs designates significant differences at p < 0.05 for AL vs. Res/Whey/Soy. (C,D,F,H) The box plots show the minimum, first quartile, median, third quartile, and maximum of humerus length after 1 (C) or 14 days refeeding (D) and EGP height at 1 (F) or 14 days of refeeding (H). EGP, epiphyseal growth plate; AL, ad libitum; RES, food restriction; CU, re-fed group, showing catch up growth.

