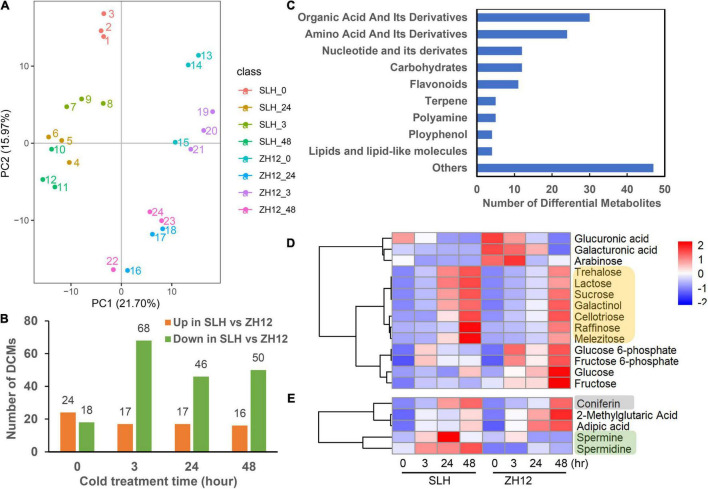
FIGURE 2.
Metabolite profiling of two peanut varieties exposed to cold stress. (A) Principle component analysis (PCA) of metabolome data derived from SLH and ZH12 during four time points under cold stress (0, 3, 24, 48 h, with three biological replicates per point). (B) The differentially changed metabolites (DCMs) between the SLH and ZH12 under cold stress. The DCMs were screened by the criteria of | log2 (fold change) | > 1 and P-value < 0.05. (C) Classification of 145 DCMs between the two cultivars. (D,E) The accumulation pattern of carbohydrates (indicated by yellow), polyamines (marked by green), and phenols (gray) under cold stress in SLH and ZH12. The relative contents of metabolites (represented by the LC-MS/MS peak area) in different samples were used for z-scale normalization in the heatmap. The red color indicated relative high content of substances, while blue was low.

