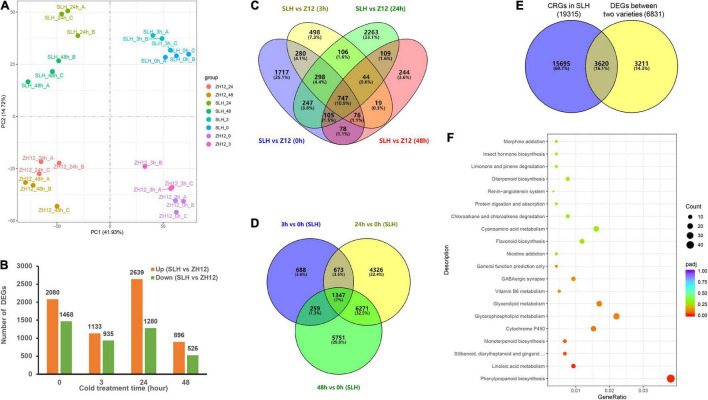
FIGURE 3.
Transcriptome analysis of two peanut cultivars in response to cold stress. (A) Principle component analysis (PCA) of transcriptome data derived from SLH and ZH12 during four time points under cold stress (0, 3, 24, 48 h, with three biological replicates per point). (B) The number of differentially expressed genes (DEGs) between SLH and ZH12 exposed to cold treatment. DEGs were filed out using the DESeq2 R package with the parameter of | log2 (fold change)| > 1 and an adjusted P-value < 0.01. (C) The Venn diagram of DEGs between the two cultivars at four different cold treatment time points. (D) The Venn diagram of Cold Responsive Genes (CRGs) in SLH in the three cold exposure times (3, 24, and 48 h) compared to control (0 h). (E) The Venn diagram showing 3,620 putative Cold Tolerance Genes (CTG) in peanut. The yellow circle refers to the total 6,831 DEGs during the cold treatments between the two cultivars as shown in panel (C), and the blue circle represents the total 19,315 cold-responsive genes (CRGs) in SLH as indicated in panel (D). (F) KEGG enrichment analysis of the 3,620 Cold Tolerance Genes (CTG) in peanut.

