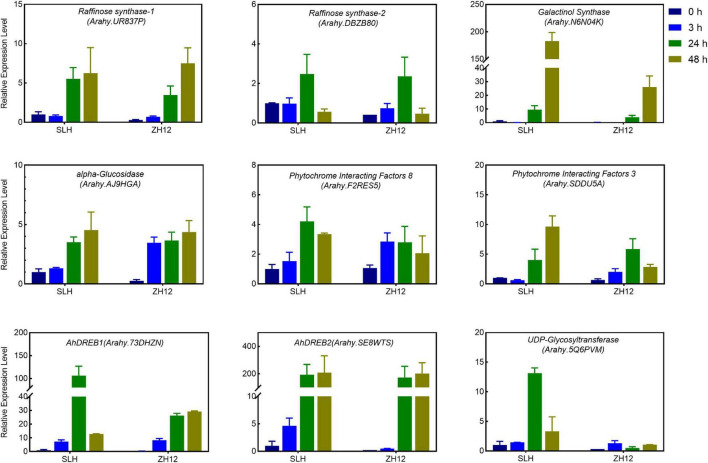
FIGURE 4.
Quantitative RT-PCR (qRT-PCR) analysis of the expression levels of selected Core Cold Tolerance Genes in the peanut seedlings subjected to cold stress. The relative transcript levels among different samples were quantified by the 2− ΔΔCt method, with A. hypogaea Actin gene as the reference gene for normalization. Error bars indicate the S.D. of the means of three biological replicates.

