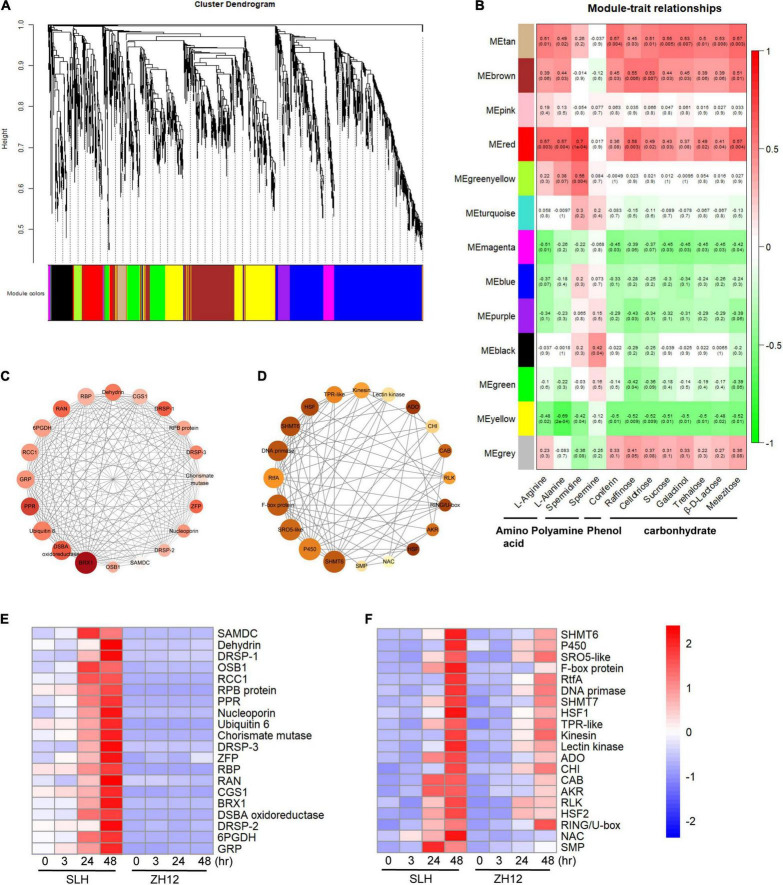
FIGURE 5.
Identification of hub genes and key modules responsive to cold stress in peanut by WGCNA. (A) The hierarchical cluster tree shows 13 modules of co-expressed genes. Different modules are marked with different colors. (B) Correlations of metabolite contents with WGCNA modules. Each row corresponds to a specific module eigengene and a column to a trait. The values in each cell represent the correlation coefficients (r), and the p-values (in parentheses) of the module-trait association. The deeper the red or green in a cell, the higher the positive or negative correlation between the module eigengene and a trait feature. Visualization of the key co-expression network red module (C) and the tan (D) module by Cytoscape. The top 20 hub genes with the highest degree of connection to other genes are shown in the nodes. The color of node corresponds to degree value, and size means module membership value calculated by WGCNA. The darker and larger of the nodes indicates the greater hubness of the gene. Hierarchical cluster analysis of the top 20 hub genes in the red module (E) and the tan (F) module. The values in the heatmap (E,F) represent the z-score of the FPKM (transcript levels) in different samples. Red color indicates a high expression level, while blue is low.

