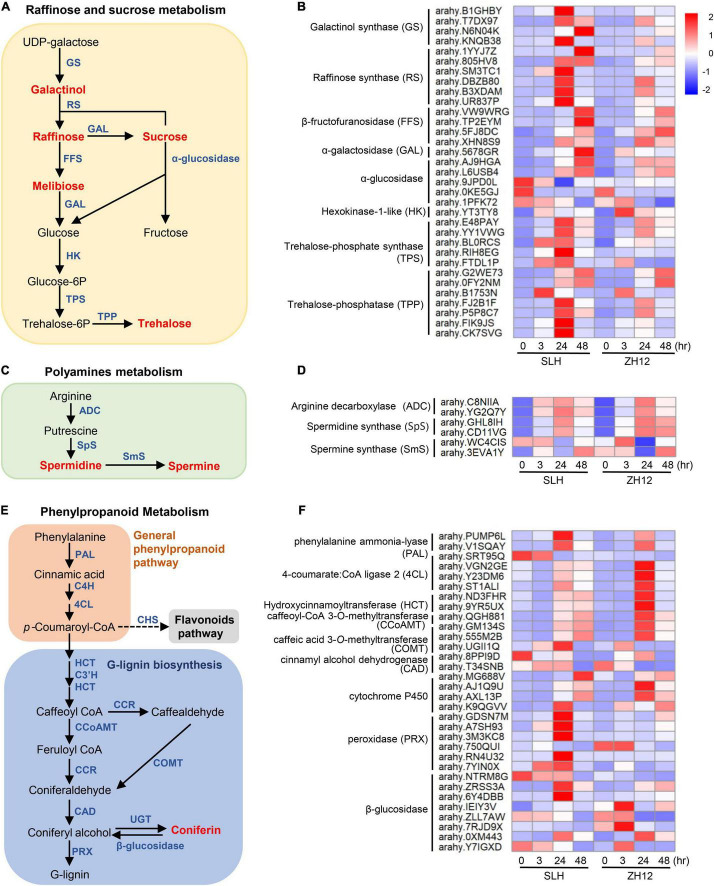
FIGURE 6.
Integrated analysis of metabolomic and transcriptomic profiles of peanut under cold stress. The schematic diagrams of raffinose and sucrose (A), polyamines (C), and phenylpropanoid (E) metabolism pathways. In the diagrams, the metabolites are marked by red, and structural enzymes are indicated by blue. The transcriptional patterns of several structural genes involved in the raffinose and sucrose (B), polyamines (D), and phenylpropanoid (F) metabolism pathway under cold stress. The heatmap values represent the Z-score of the FPKM (transcript levels) in different samples. Red color indicates a high expression level, while blue is low.

