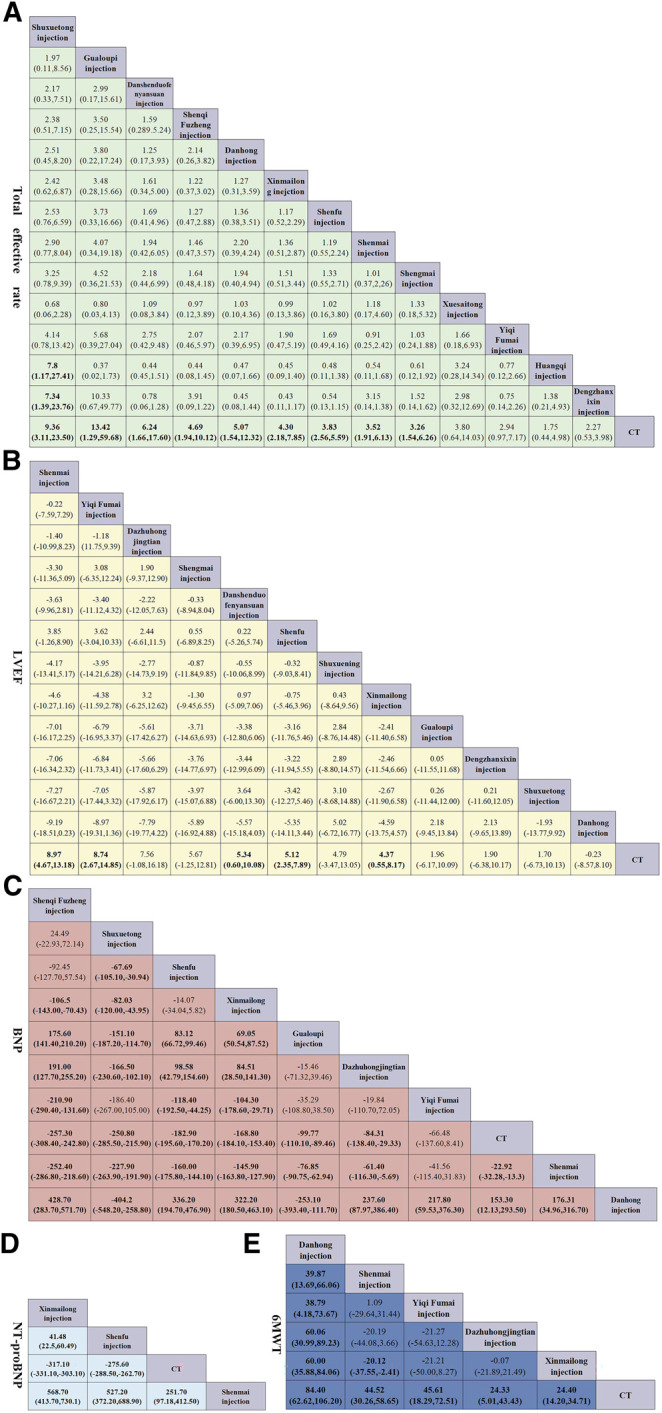
FIGURE 4.

Pooled estimates of the network meta-analysis. (A) Pooled odd ratios (95% credible intervals) for the total effective rate. (B) Pooled odd ratios (95% credible intervals) for LVEF. (C) Pooled odd ratios (95% credible intervals) for NT-proBNP. (D) Pooled odd ratios (95% credible intervals) for BNP. (E) Pooled odd ratios (95% credible intervals) for 6MWT. Data in each cell are hazard or odds ratios (95% credible intervals) for the comparison of row-defining treatment versus column-defining treatment. Significant results are in bold. All the TCMIs based on CT.
